How monitoring applies to accounts
In Kaseya MDR, billing and monitoring are separate concerns. Kaseya MDR billing is based on agents that have checked in (been online) within the last 30 days, independent of how accounts are classified or configured. Kaseya MDR continues to ingest telemetry and surface security‑relevant activity for all supported identities, regardless of account status.
This article explains how to review monitored accounts and account‑level context using the Accounts view available in Kaseya MDR.
Account-level information can be reviewed as follows:
-
Organization‑scoped Accounts view: Accessed from the Organizations page by selecting an organization and then using either the Go to Accounts icon or the Edit Organization option (pencil icon).
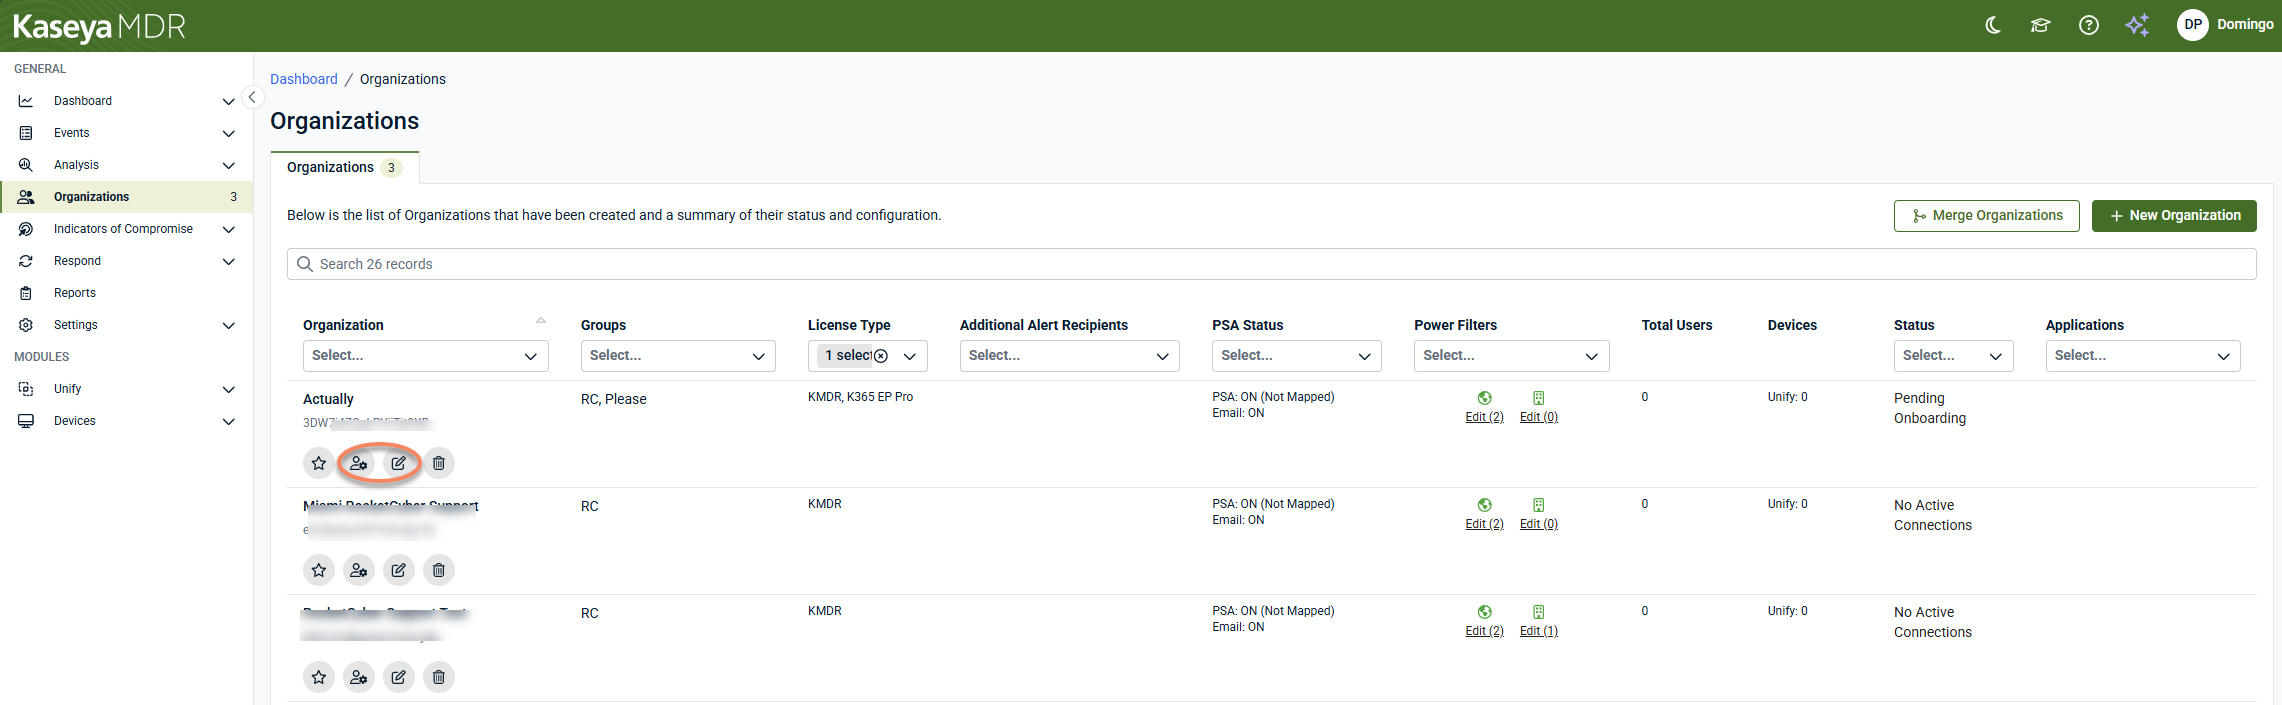
The Go to Accounts icon opens the Accounts tab directly, while the Edit Organization option opens the organization view, from which the Accounts tab is available. This view provides per‑organization context such as connected applications, account classifications, Power Filters context, and organization‑level defaults.
In the organization‑scoped Accounts view, additional columns appear to provide context about how an account behaves within the selected organization, such as Connected Applications, Power Filters, or organization‑level defaults like File Events Trigger thresholds. These columns primarily provide contextual visibility into account behavior and organizational scope. While some governance‑level settings can be accessed from this view (such as Power Filters), it does not control telemetry ingestion, detection logic, or SOC response behavior.
Step 1: Review organization-level account context
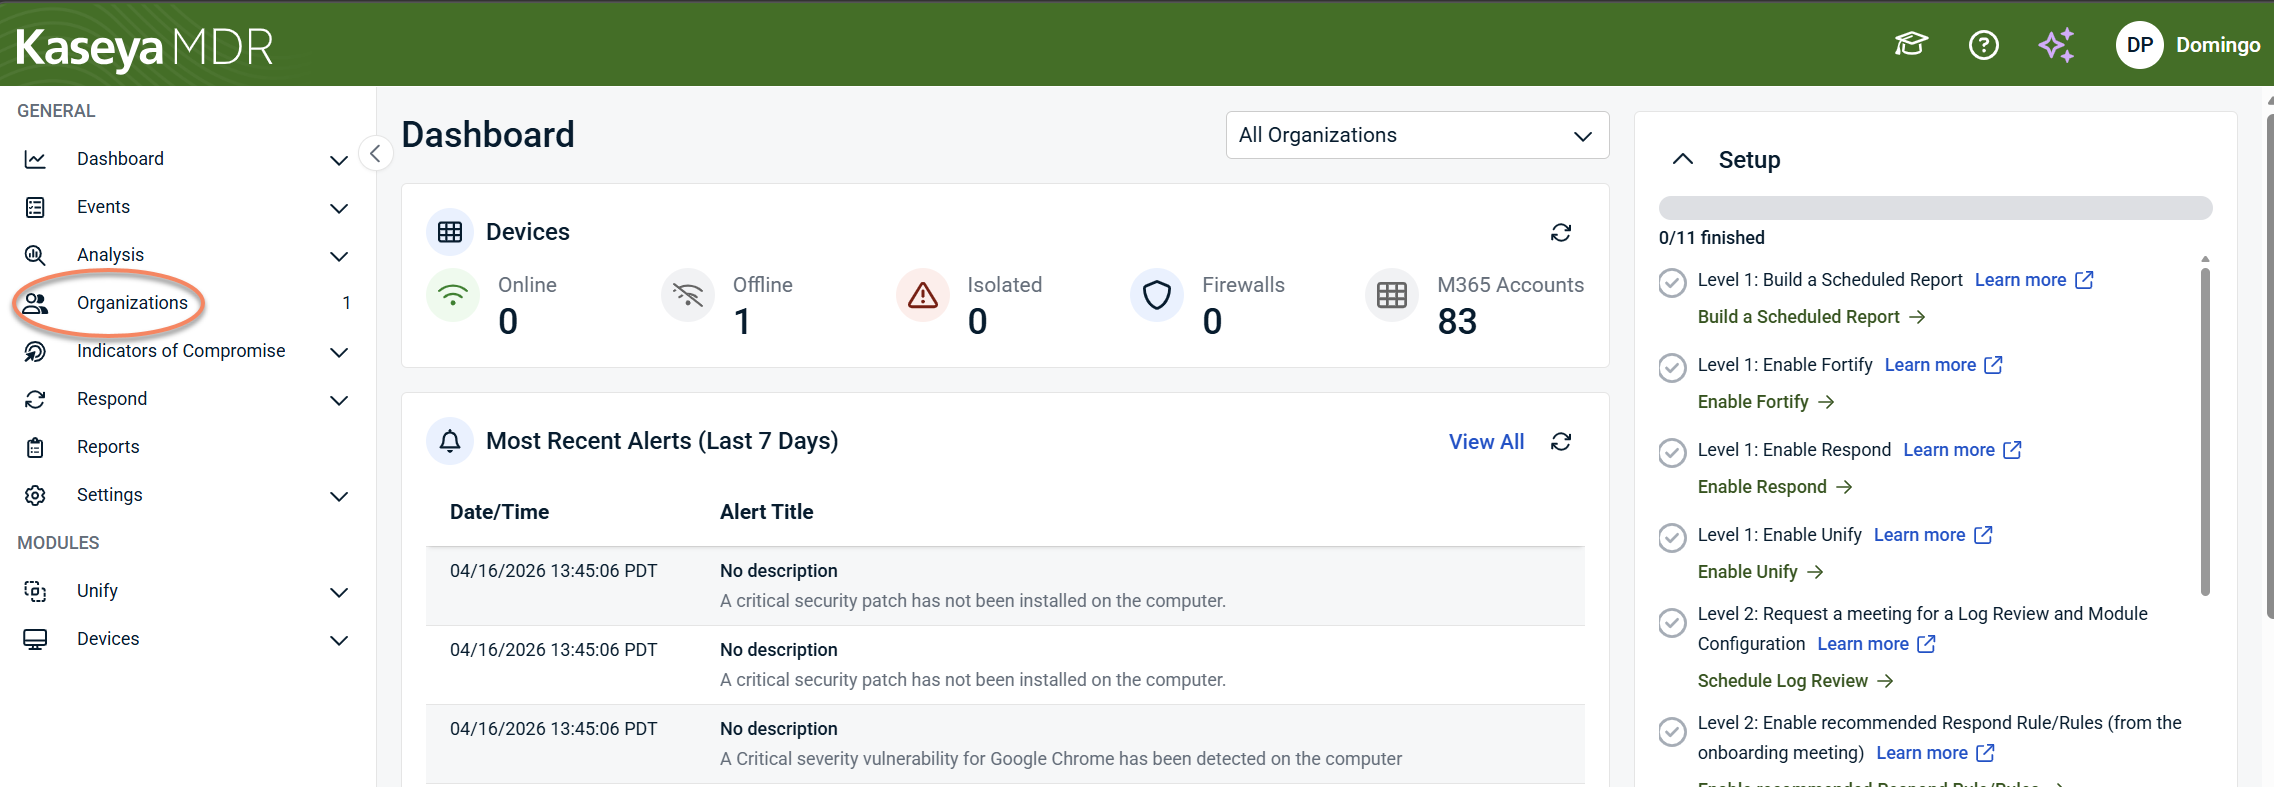
The Organizations page provides the first, high‑level view of how accounts and devices are represented across tenant organizations.
To review organization‑level counts:
-
From the side navigation menu, select Organizations.
-
On the Organizations tab, review the organization list and columns, including:
-
Organization (name and ID)
-
Groups
-
License Type
-
Additional Alert Recipients
-
PSA Status
-
Power Filters
-
Total Users
-
Devices
-
Status
-
Applications
-
This view allows you to:
-
Review user and device counts per organization
-
Spot onboarding, connection, or status conditions that may affect monitoring coverage (for example, Pending Onboarding or No Active Connections)
-
Review Power Filters and PSA mapping status at a glance for each organization
The organization list footer also displays aggregate totals across all organizations, including Total Users and Total Devices (broken down by Unify, agents, and firewalls).
If an organization appears in more than one product, review its License Type configuration to confirm which products are intended. License selection determines product association and can affect how accounts and usage appear across products. For background on how license selection influences product association, see Understanding license type selection and product association.
Step 2: Review account‑level context within an organization
From the Organizations page, select an organization and open its Accounts tab using either the Go to Accounts icon or the Edit Organization option (pencil icon).
This view provides per‑organization account context, including connected applications and Power Filters, to help you understand how identities are represented and monitored within the organization.
The Accounts tab is primarily informational and contextual. It helps explain how identity data is interpreted within the organization and supports limited governance interactions (such as Power Filters), but it does not control detection behavior or identity lifecycle actions such as blocking or deleting accounts.
Step 3: Filter and review accounts
Filters and indicators are available in the organization-scoped Accounts tab to help explain account classifications, monitoring context, and account status.
Account classifications and status
Use the available filters to review accounts that may require administrative review or represent different identity types, such as:
-
Sign‑in blocked accounts
-
MSP user accounts
-
Guest accounts
-
Sync accounts
-
Service accounts
-
Suspended accounts
These categories help identify accounts that are monitored but may represent reduced or elevated identity risk, and are useful for hygiene and governance review.
Connected applications
The Connected Apps column shows which integrations contribute identity‑related telemetry for the account within the selected organization. This helps explain why an account appears in monitoring.
Power Filters
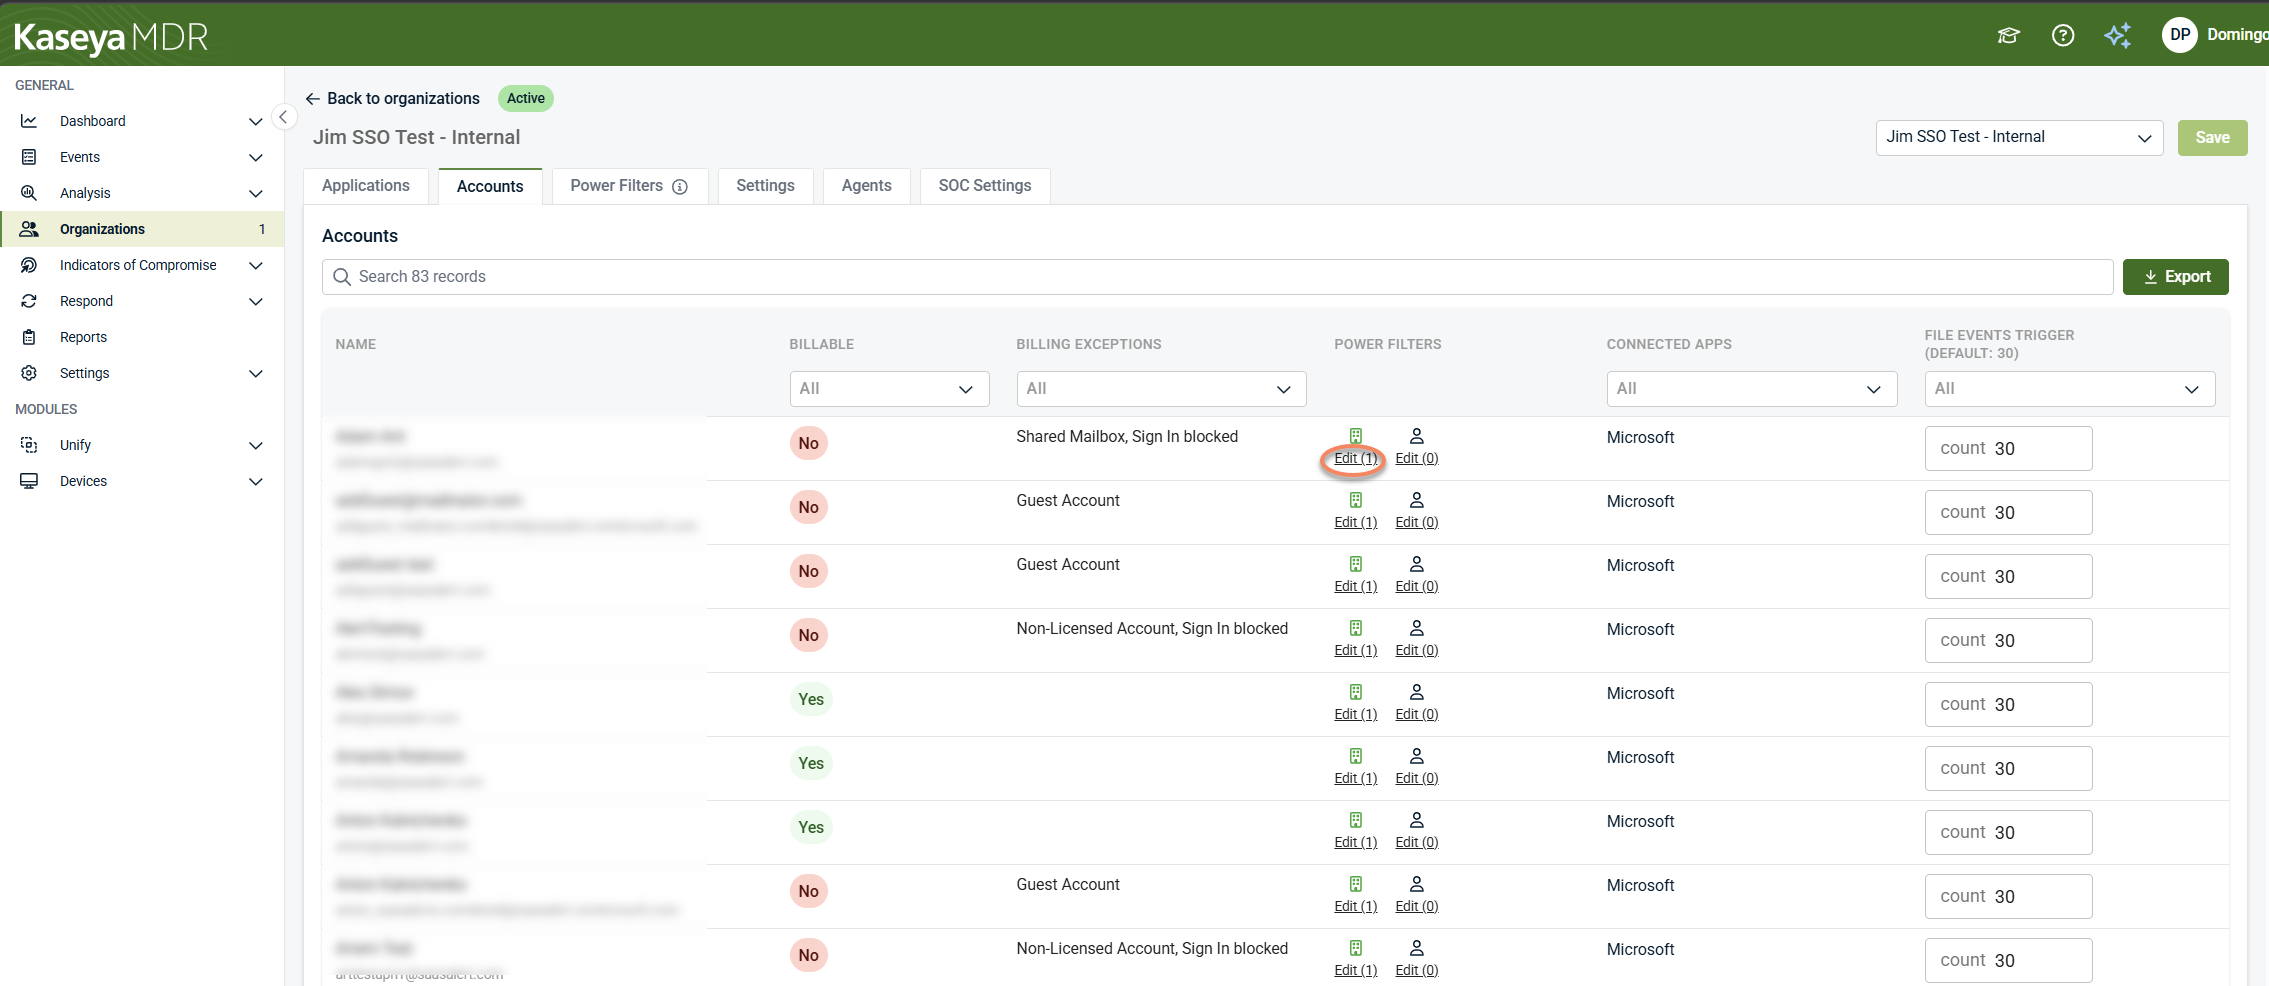
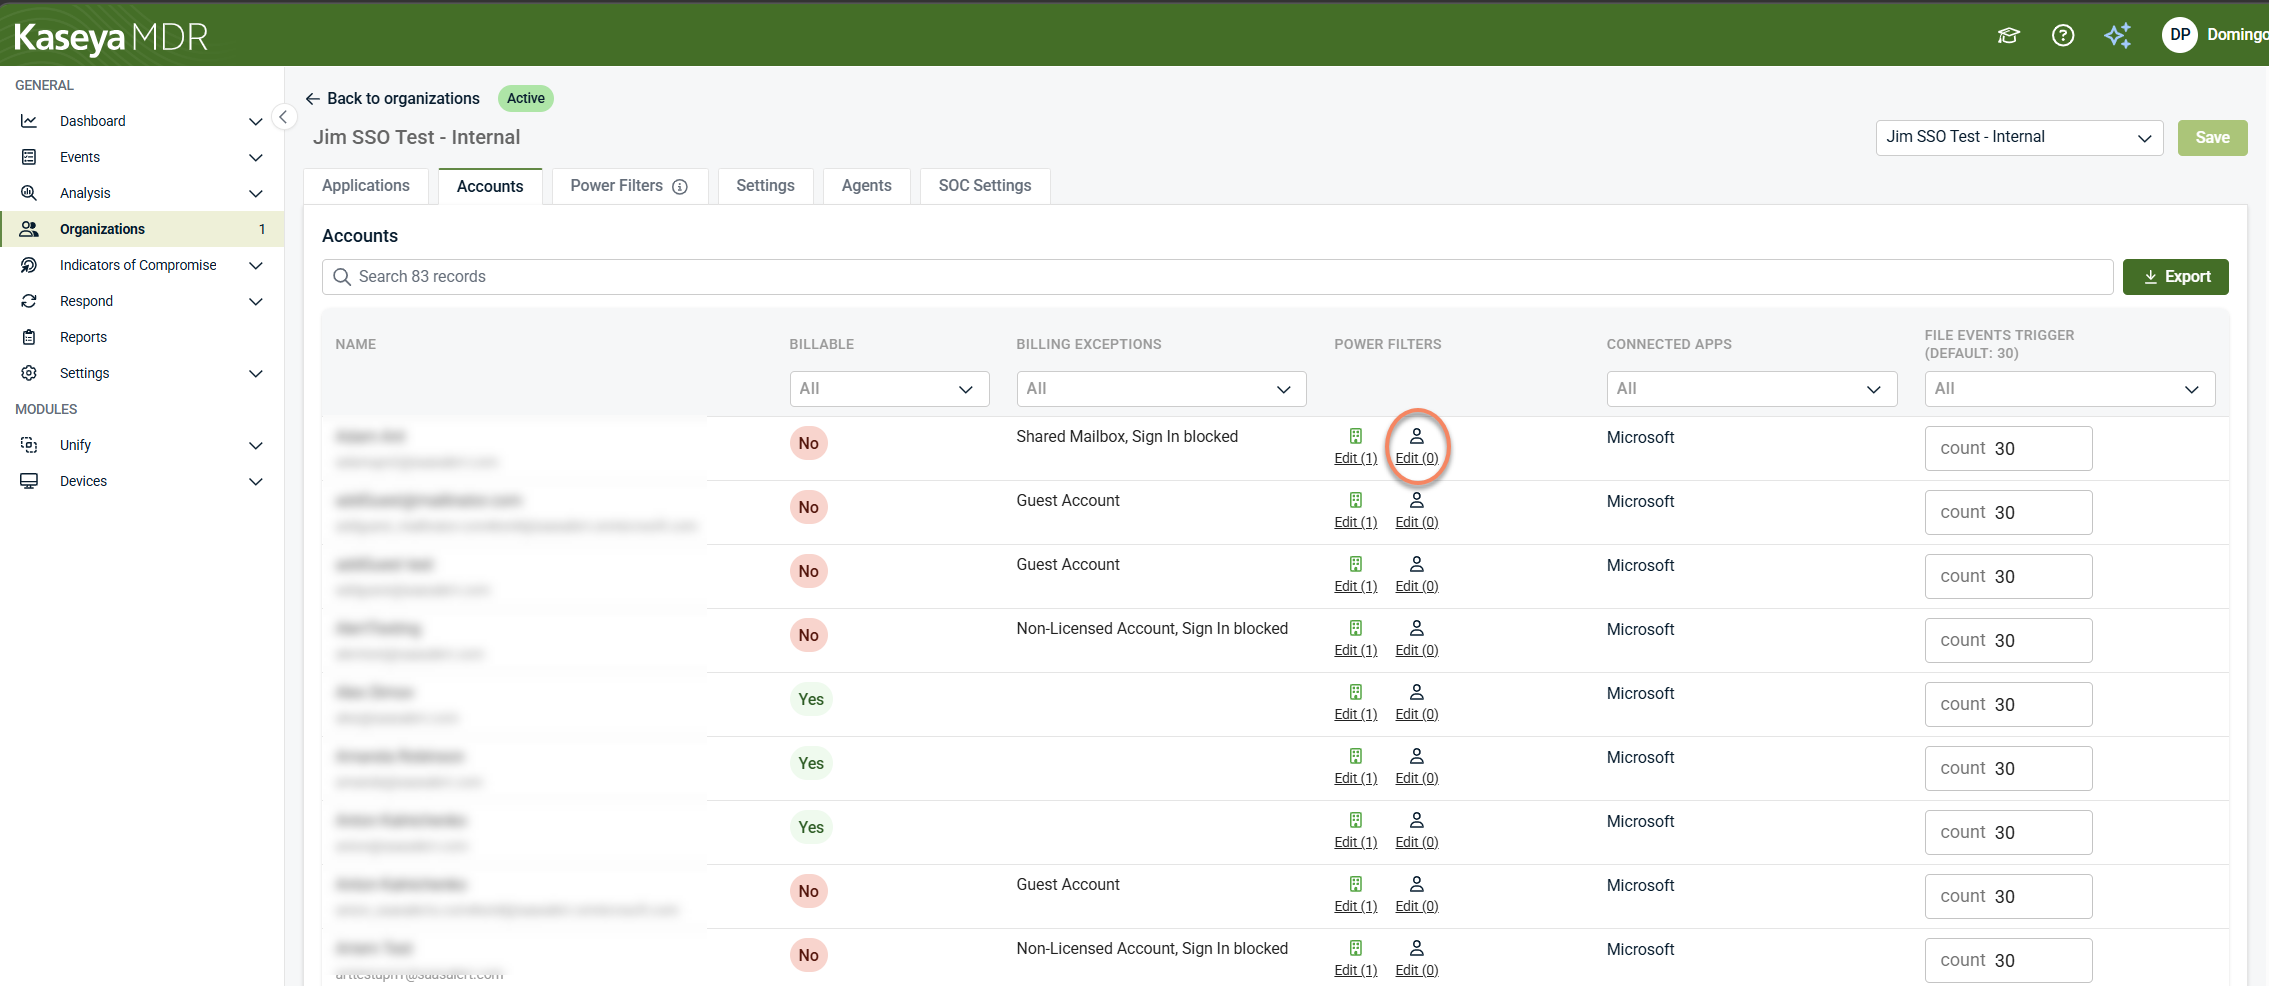
The Power Filters column in the Accounts table provides a summarized view of location‑based filtering context for each account. It reflects where Power Filters are applied and whether those filters are inherited or defined at the account level.
When you interact with the Power Filters column, there are three separate clickable controls, each with a different outcome:
-
Organization icon (inheritance toggle): Clicking the organization icon enables or disables inheritance for the account.
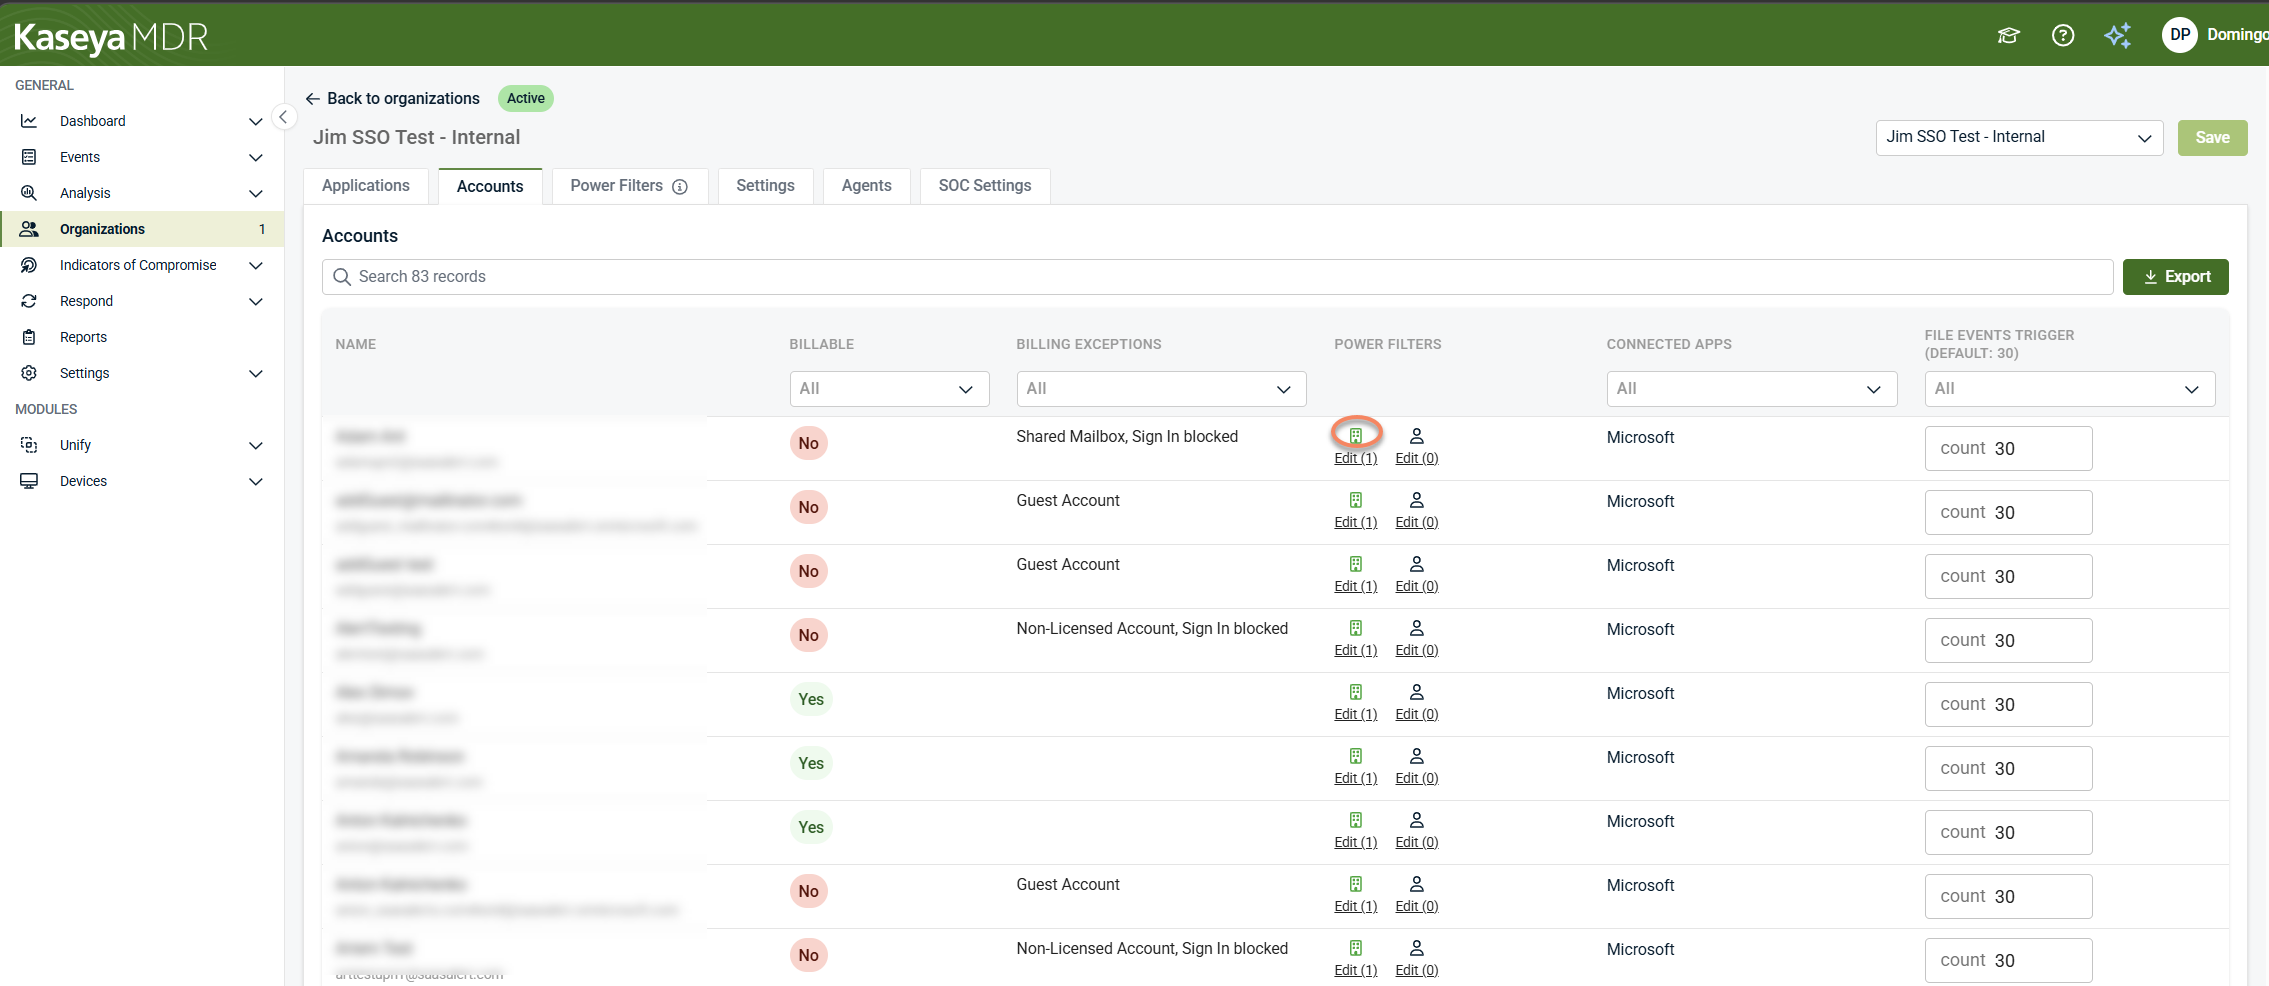
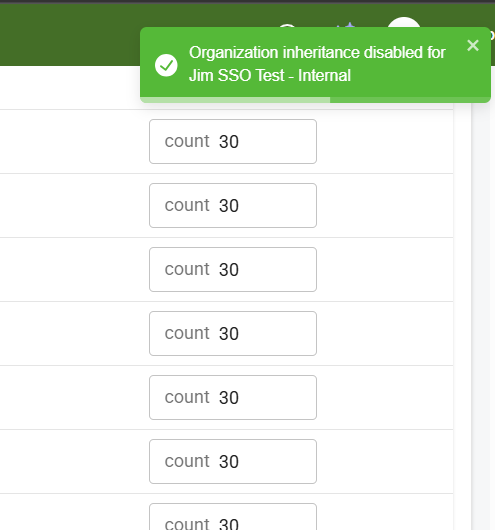
A confirmation message indicates whether inheritance was enabled or disabled.
-
Edit under the organization icon (organization-level Power Filters): Clicking the Edit link under the organization icon opens the organization’s Power Filters tab, where organization-level Power Filters can be reviewed or modified. The number shown in Edit (n) reflects how many organization‑level filter entries currently exist.
-
Edit for account-level Power Filters (account dialog): Clicking the other Edit control opens an account-level Power Filters dialog, where Power Filters can be added, modified, or removed for that specific account. The number shown in Edit (n) reflects how many account‑level filter entries currently exist.
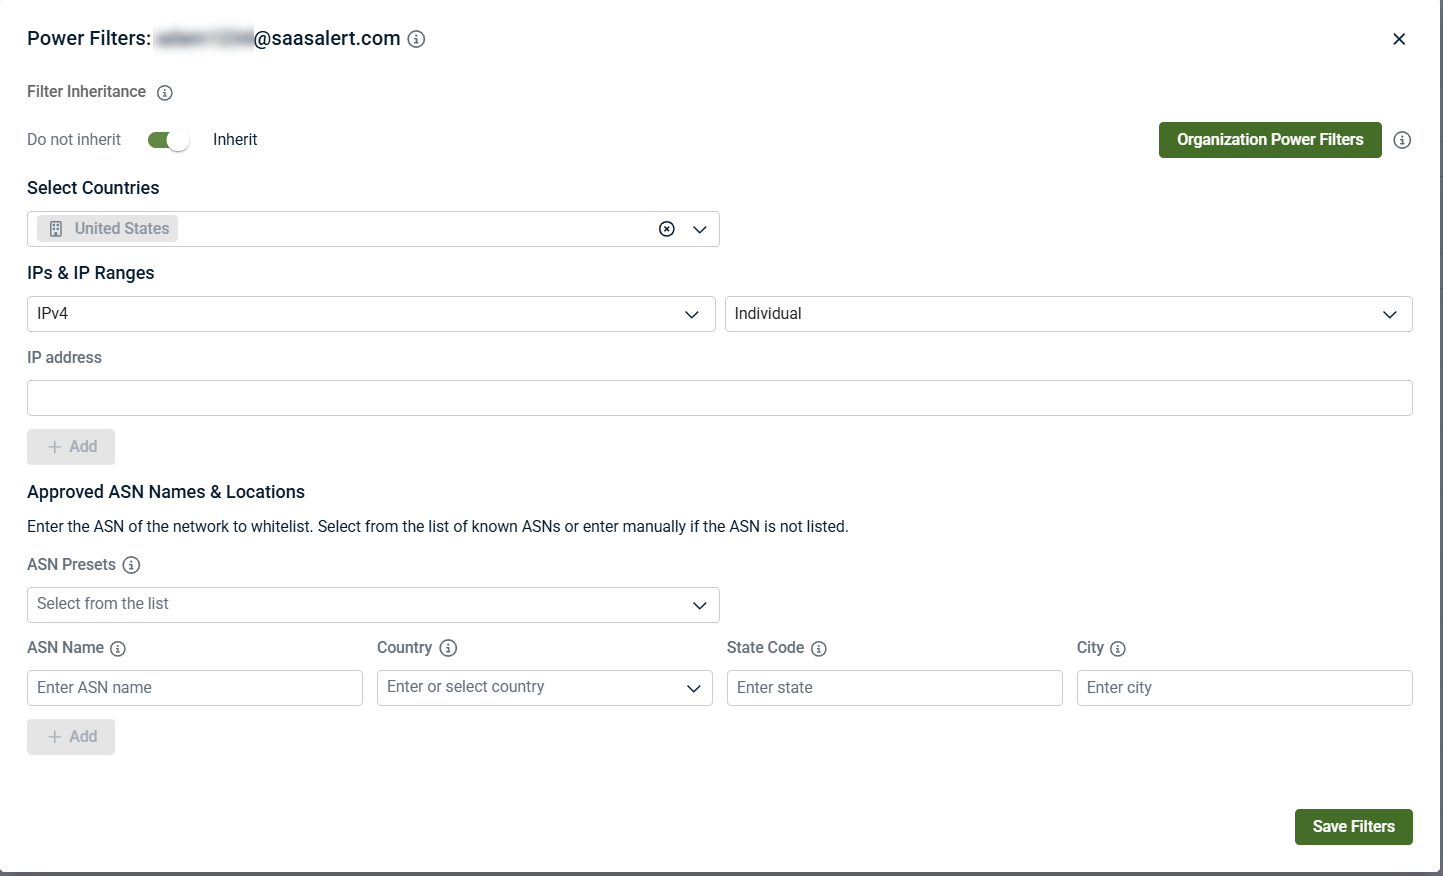
Conceptually, the Power Filters column explains how filtering scope is applied to the account, not whether specific activity is allowed or blocked. Power Filters can exist at multiple scopes (global, organization, and account) and inheritance can be enabled or disabled as needed.
Power Filters influence investigation focus by distinguishing expected activity from anomalous behavior. They do not stop telemetry ingestion, do not prevent alerts from being created, and do not alter monitoring coverage. For more detail, see Power filters and allowlisting logic.
File events trigger (organization default)
The File Events Trigger column shown in the Accounts view shows which file‑event trigger setting applies to the account and provides visibility into the organization‑level default currently in use.
In this view, the File Events Trigger is displayed with the following indicators:
-
Default: The account is using the organization’s default file‑event trigger setting. The default value is shown in the column label (for example, Default: 30).
-
Customized: The account is associated with a customized file‑event trigger setting defined at the organization level.
-
All: File events are included without applying the organization’s default trigger threshold.
The numeric value shown (such as count 30) reflects the organization‑level default threshold and is displayed for context only.
From the Accounts tab, the File Events Trigger column does not allow direct modification of the threshold value and does not represent a per‑account configuration control. It is shown to help explain how file‑event alerting is scoped for the account within the organization.
The organization‑level default for File Events Trigger is configured from the Organizations page by selecting an organization, clicking the Edit Organization (pencil icon), and opening its Settings tab. The Default file events trigger setting defines the numeric threshold used as the organization's default value and applies wherever the File Events Trigger is shown as Default in the Accounts view.
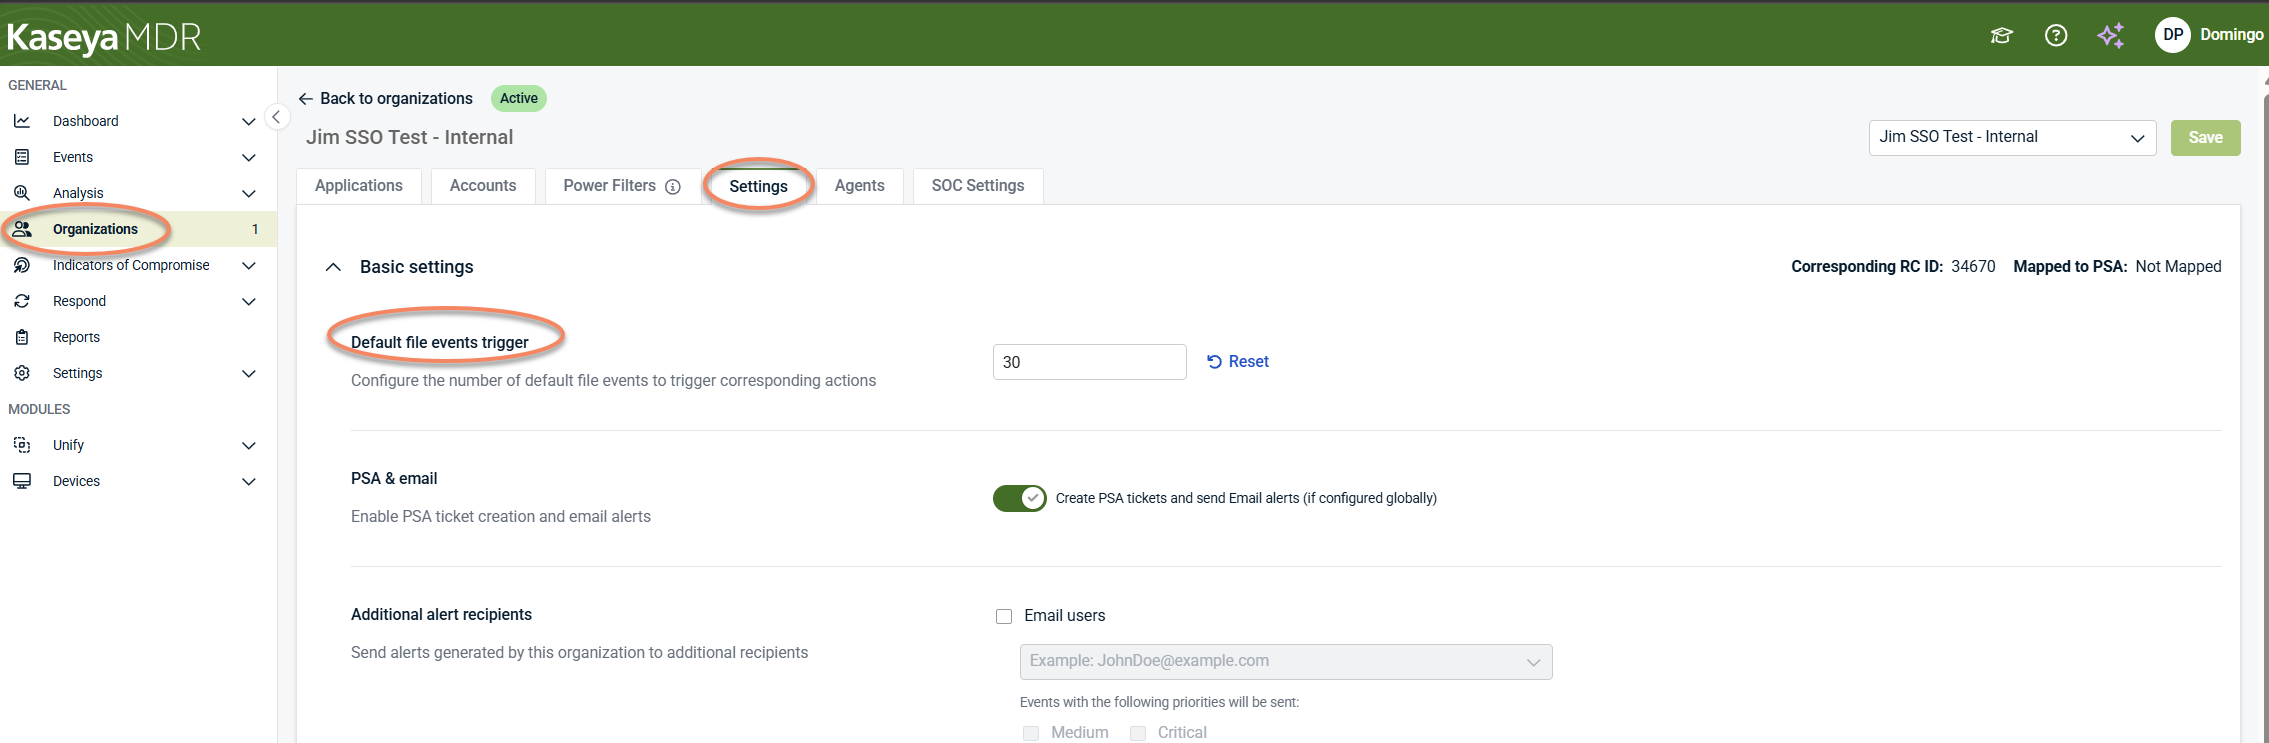
Changes to the Default file events trigger setting take effect only after selecting Save in the organization’s Settings tab.
Understanding Kaseya MDR billing
Kaseya MDR billing is calculated based on agents that have been online within the last 30 days, independent of accounts. Account status, account type, or account‑level configuration (such as Power Filters or File Events Trigger settings) does not affect billing.
Account monitoring and detection remain active for all supported identities regardless of agent billing status. Nothing described in this article (connected applications, Power Filters, File Events Trigger, or account hygiene filters) affects:
-
Telemetry ingestion
-
Alert generation
-
Correlation or investigation workflows
-
Fortify posture evaluation
-
Respond rule execution
-
Reporting or evidence availability
Key takeaway
-
Kaseya MDR billing is based on agents online within the last 30 days, and is independent of accounts.
-
Start at the Organizations page to understand account and device counts at a glance.
-
Use the Accounts tab to review account‑level context, connected applications, and Power Filters within an organization.
-
Account‑level settings and views described here support monitoring, governance, and hygiene, not billing.
-
Changes to license type selection can influence where organizations appear and how usage is represented across products.
Related articles
-
Understanding license type selection and product association: Explains why organizations may appear in multiple products and why usage changes after license updates
-
Global defaults and organization overrides: Explains how settings, inheritance, and scope affect organizations and accounts
-
Power Filters and allowlisting logic: Deep dive into Power Filters behavior, inheritance, and approved‑location evaluation
-
Managing organizations: Provides broader context for organization‑level configuration and governance
-


