Working with alerts
How to review alerts, understand what they represent, and decide whether investigation is required in Kaseya MDR
Alerts are the primary way Kaseya MDR surfaces security‑relevant activity that may require investigation or response. When an alert appears, you review it from the alert details view to understand what happened, who or what is involved, and whether deeper investigation is required.
Use this article when you want to understand what an alert represents, review the available context, and decide whether deeper investigation is required. This content is intentionally focused on interpretation and decision‑making, not on taking action automatically or responding before the alert is fully understood. Alerts are typically surfaced after initial awareness from the Dashboard and are reviewed in detail here.
This article does not explain how to change alert behavior (tuning, suppression, or automation). If investigation confirms a recurring or low‑risk pattern and you need to change how future alerts behave, see Managing noise and signal.
How alert behavior decisions fit together
Use the articles in this section together as a deliberate decision ladder:
-
Start with the alert
Review the alert and understand what it represents before taking action.
-
Investigate before changing behavior
Use the Analysis page to validate context, scope, and impact.
-
Decide how (or whether) alert behavior should change
Determine whether tuning, suppression, or no action is appropriate based on investigation results.
-
Apply the selected change in the correct place
Severity or detection tuning > global prioritization changes.
See: Managing alert severity and detection tuningSuppression rules > scoped exceptions for specific conditions.
See Suppressing alerts from Events; Alert suppressionEach article in this set is intentionally scoped to one step in this process.
Avoid skipping steps. Changing alert behavior without investigation can hide meaningful security activity and reduce confidence in response decisions.
What an alert represents
An alert in Kaseya MDR represents a security‑relevant condition identified through correlated activity. Alerts are intentionally fewer than raw events so attention is focused on activity that is worth investigating.
Alerts are designed to:
-
Highlight activity that may represent risk
-
Provide initial context
-
Act as entry points into investigation
Not every alert indicates compromise, and not every alert requires response.
If you use multiple Kaseya security products (such as SaaS Alerts, Kaseya MDR, and Kaseya SIEM), similar or overlapping alerts may appear in more than one product. This is expected when the same underlying telemetry is evaluated by multiple detection engines. Alerts in Kaseya MDR represent the MDR view of that activity and are reviewed within MDR as part of an investigation‑first workflow.
How alerts are organized
Kaseya MDR uses severity to help prioritize attention, not to dictate outcomes. Security activity is organized under Events by severity, but alert review always begins in the alert details view. Severity affects priority, not how alerts are reviewed or investigated.
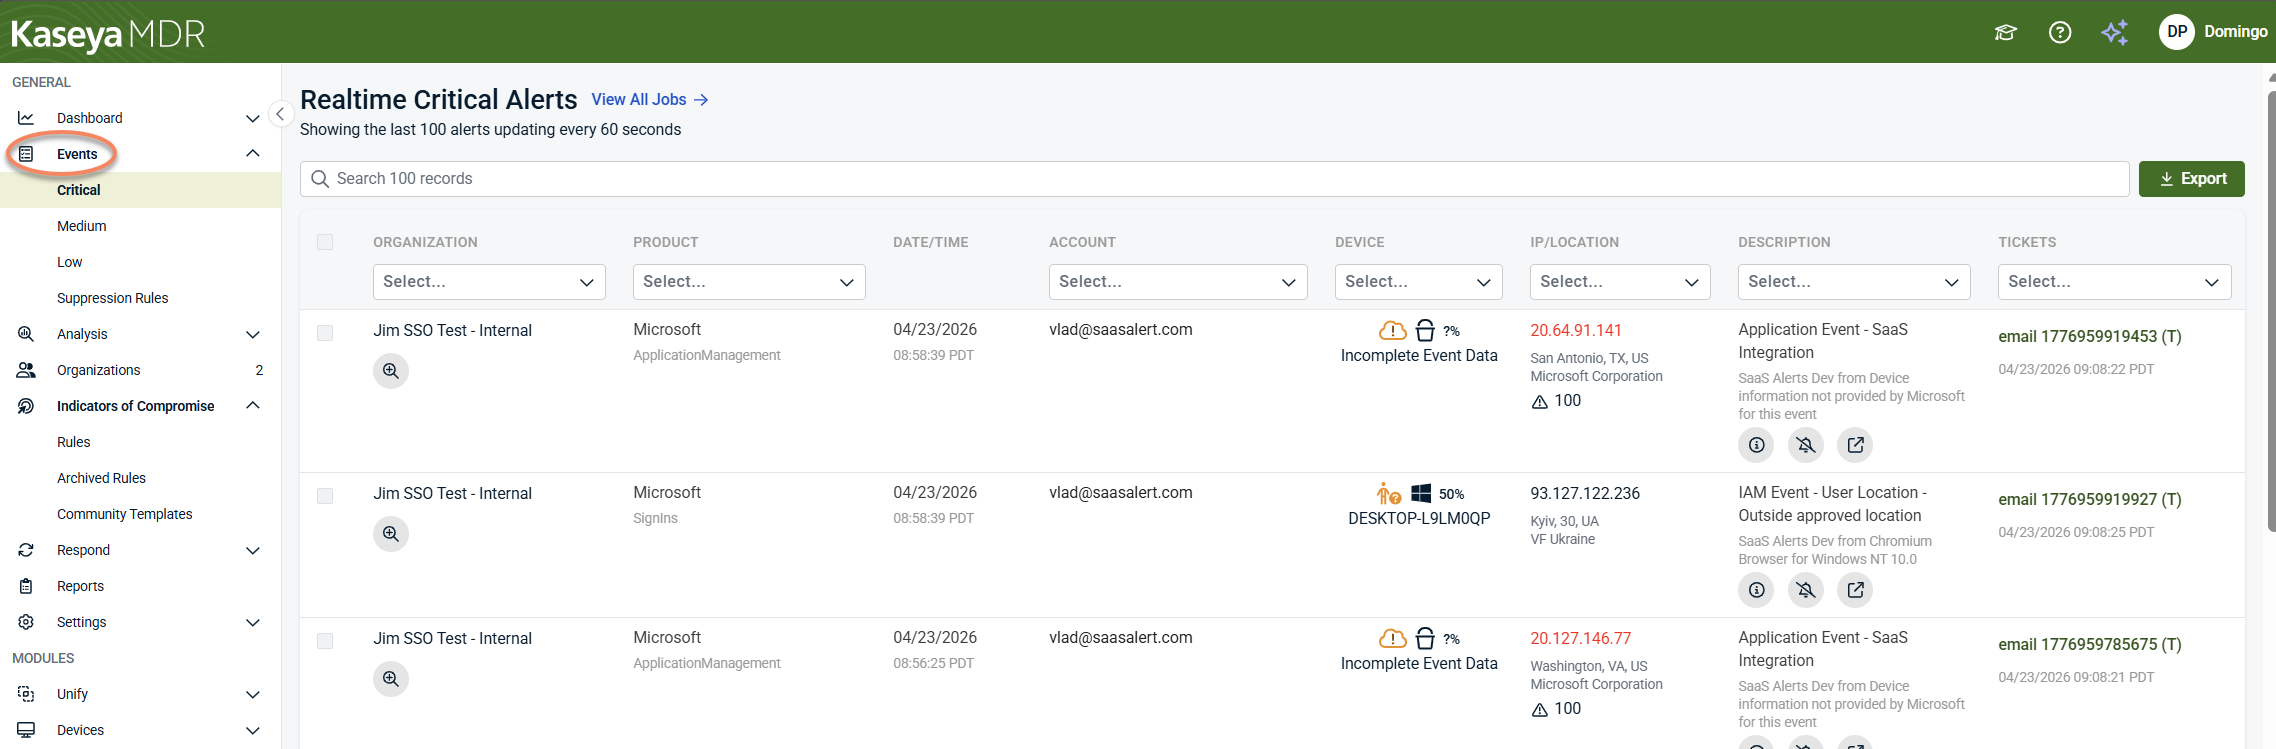
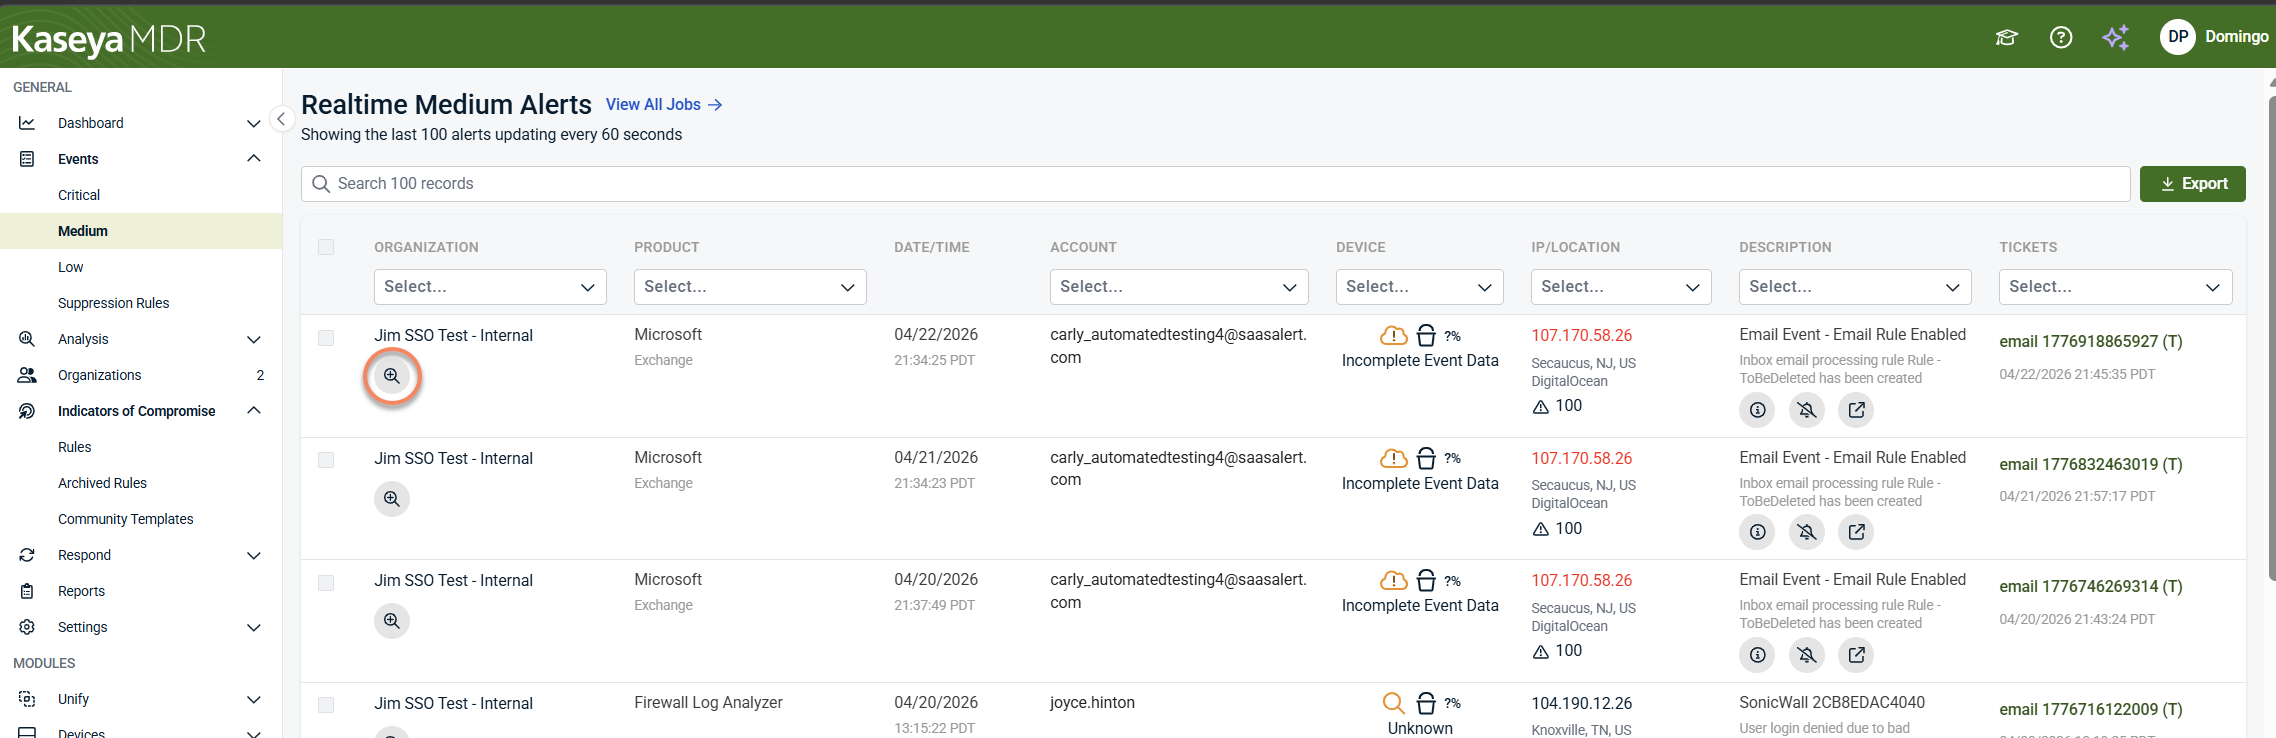
Understanding alert listings
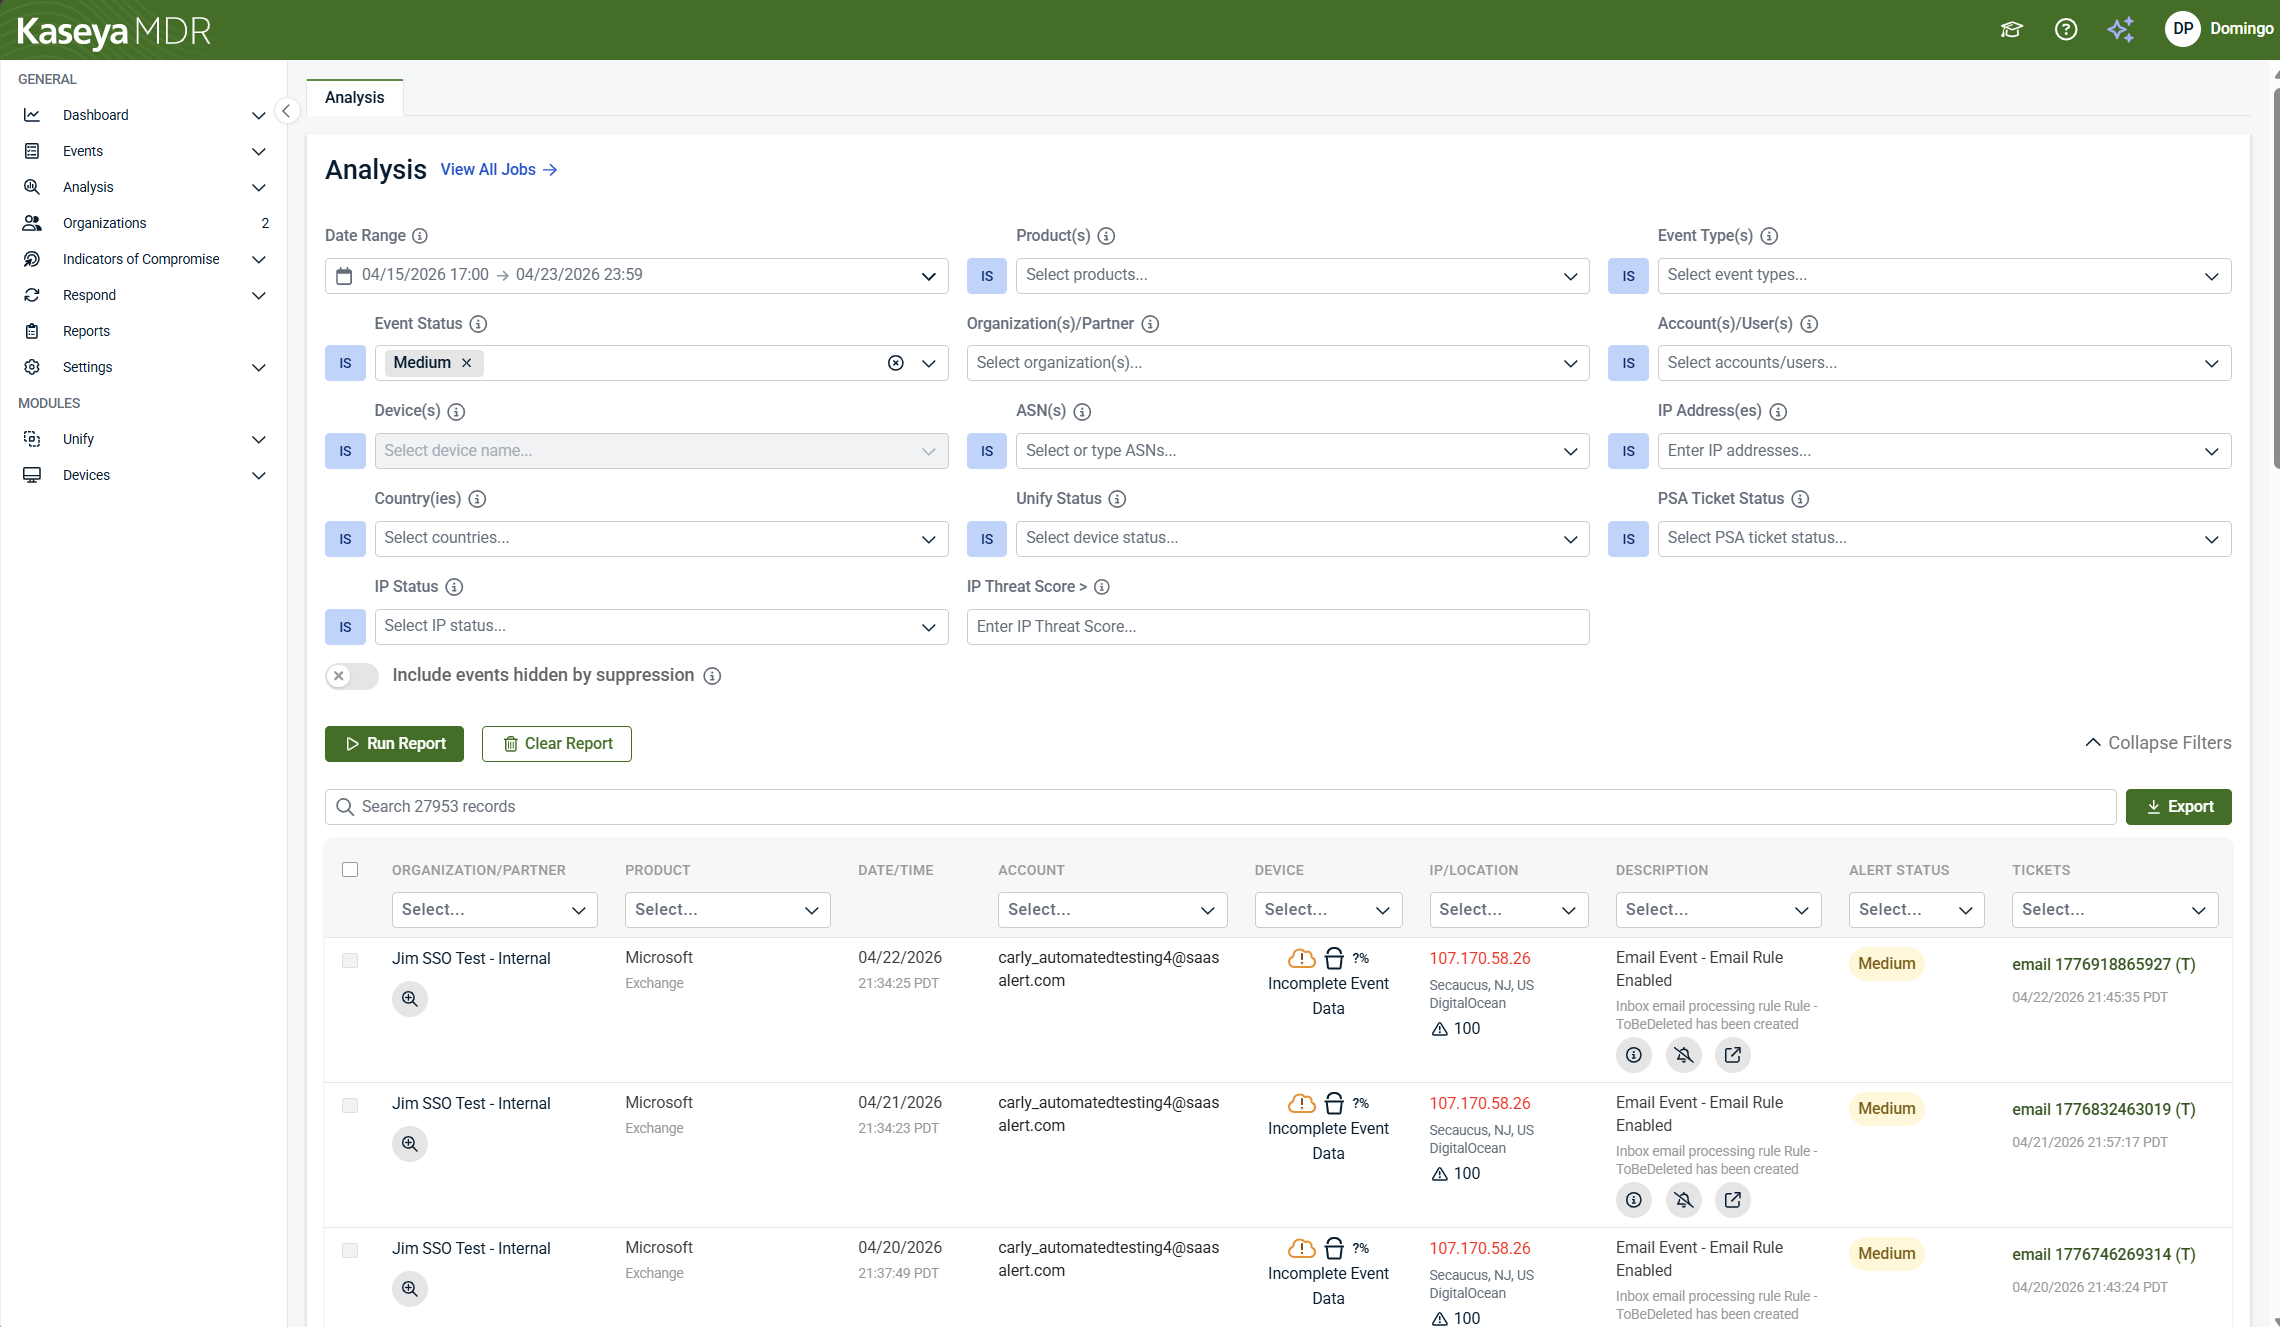
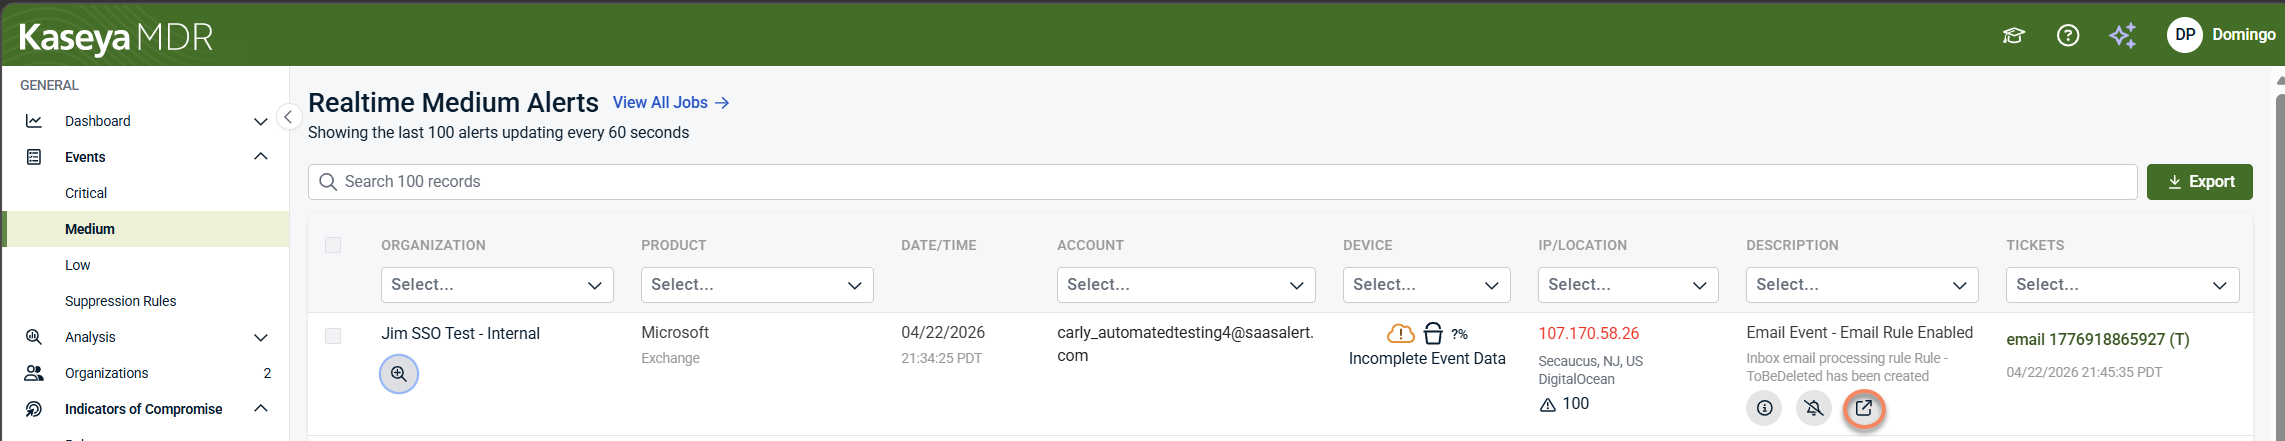
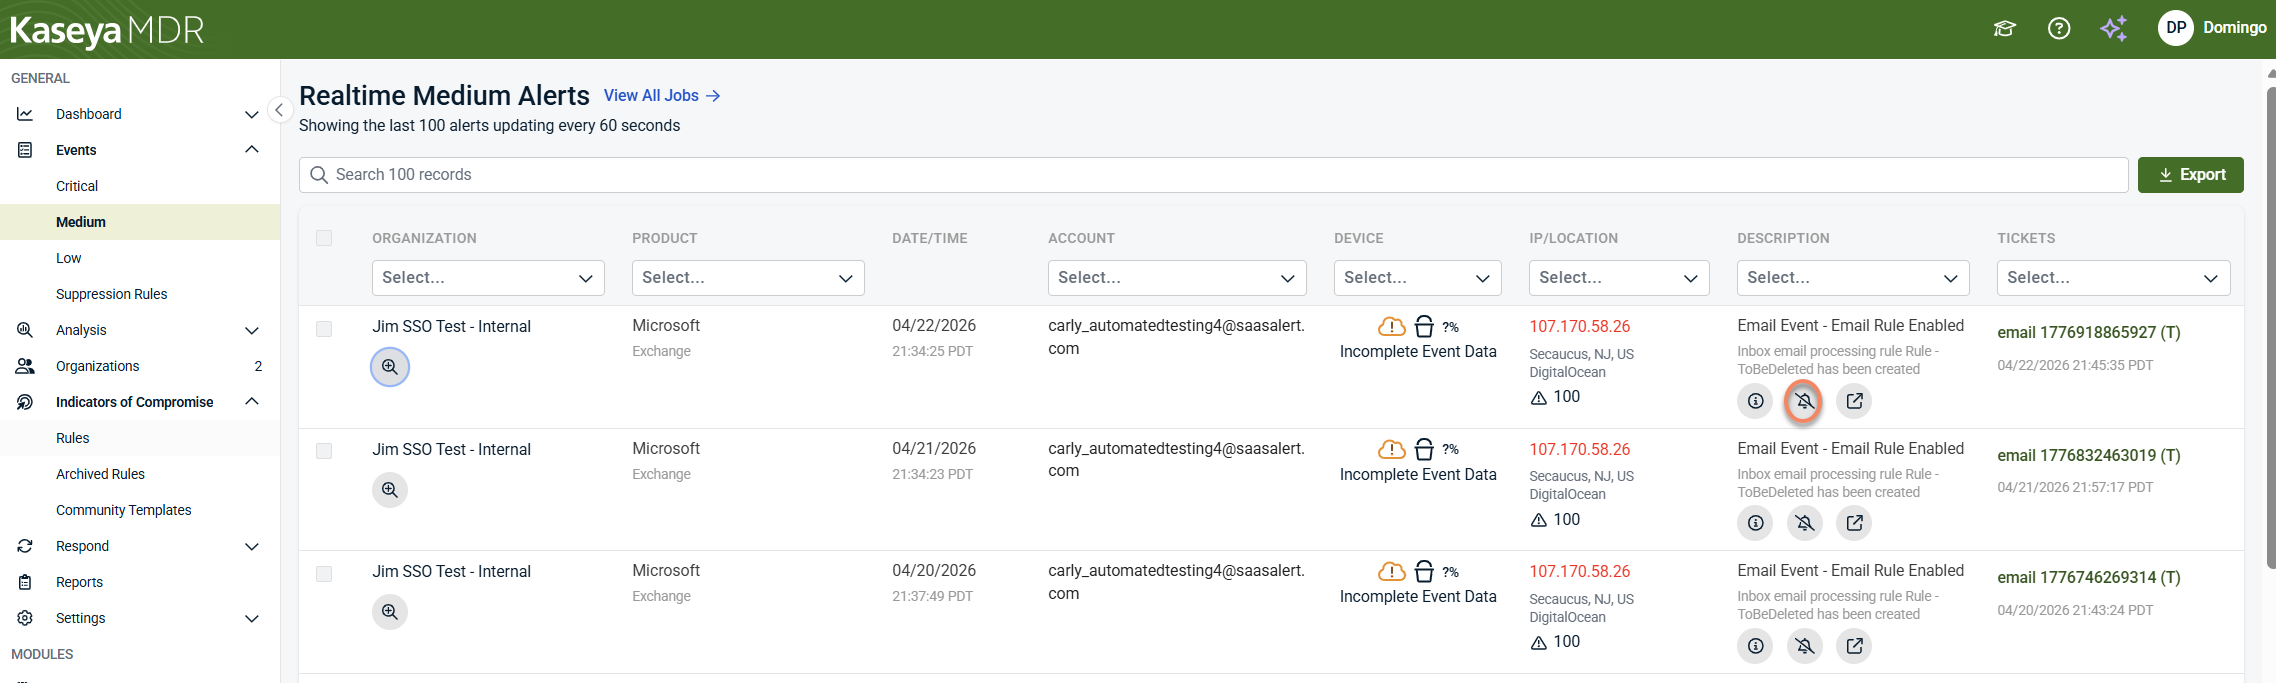
Alert listings display individual security alerts in a tabular view so you can review activity at a glance and decide which items require further investigation. Each row represents a single alert and surfaces key details directly in the listing.
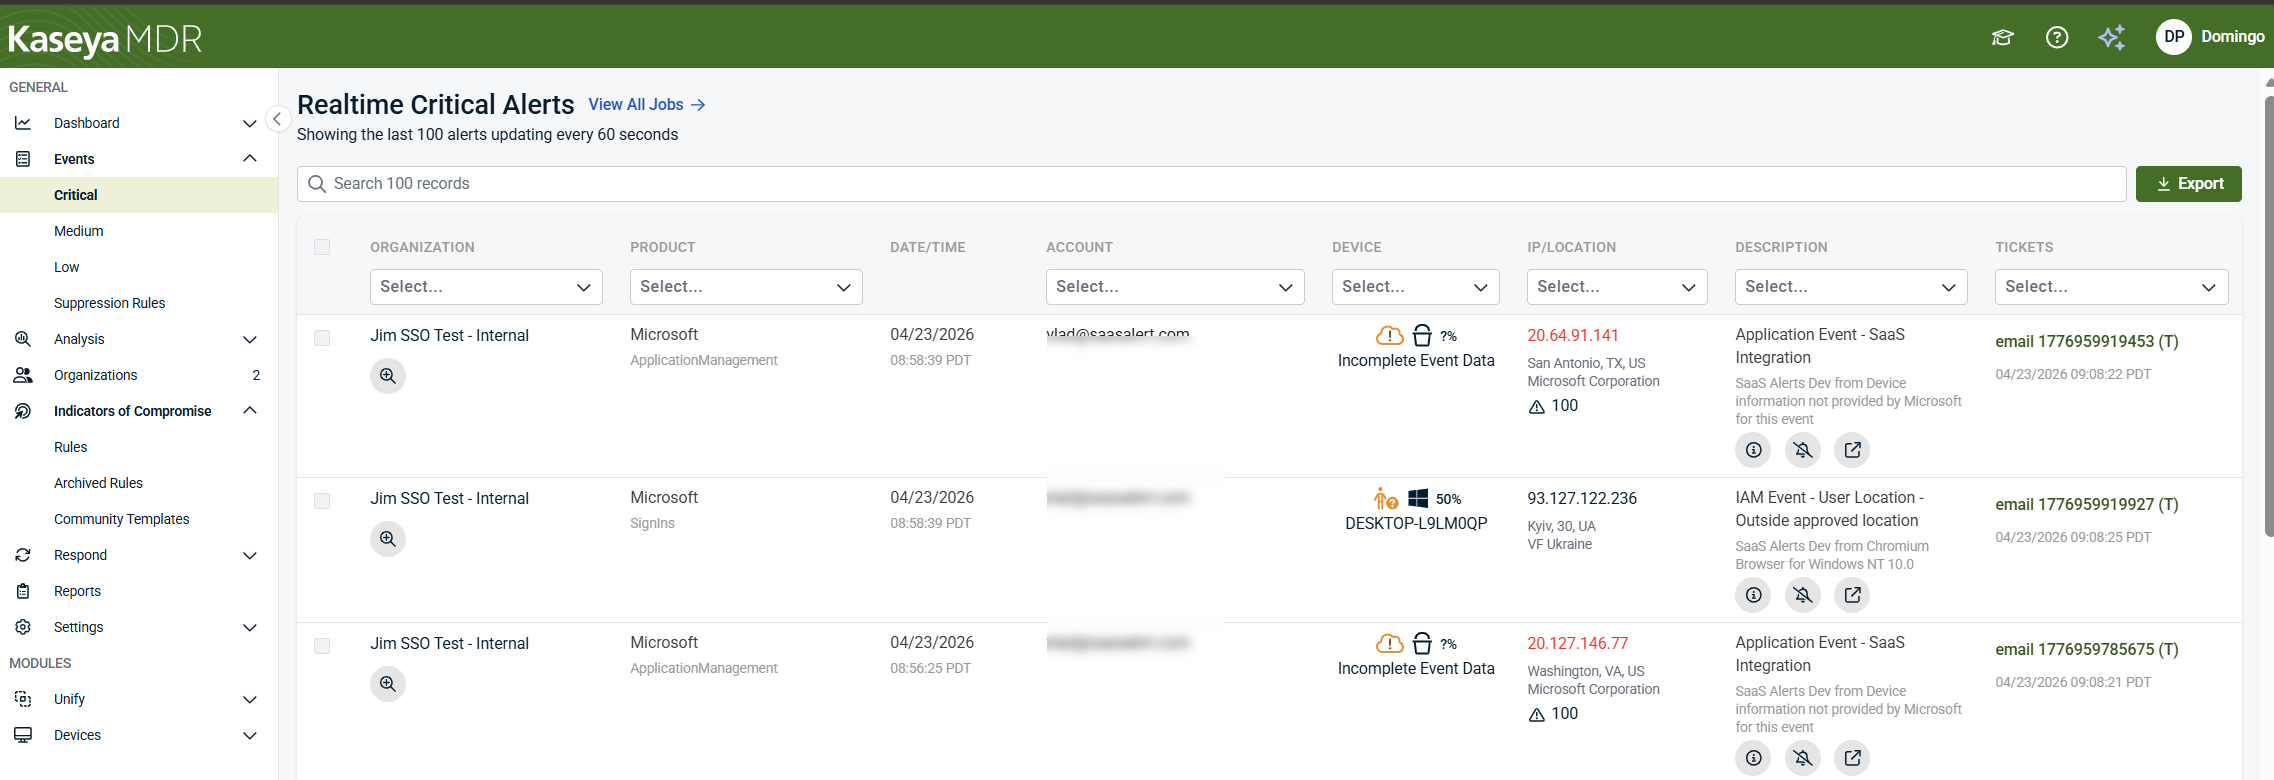
When reviewing alert listings, focus on:
-
Scope and context: Columns such as Organization, Product, Account, and Device help you understand where the alert originated and what it applies to.
-
When the alert occurred: The Date/Time column shows when the event was detected.
-
What information is available: Fields like IP/Location indicate whether source details are present or incomplete.
-
Alert details: The Description column summarizes why the alert was generated and can be expanded to reveal additional technical detail associated with the event.
-
Follow‑up status: The Tickets column indicates whether the alert is associated with an external ticket or has been ignored.
The icons shown in the Description column provide shortcuts into later workflows. For example, selecting the Recommendation (ⓘ) icon opens alert‑specific recommendations, selecting the bell icon opens the event suppression flow, and selecting the analysis icon opens the Analysis page with relevant context already applied.
![]()
These actions are intentionally explained in the related alert‑focused articles that follow in this section, rather than in detail here.
Alert listings also include an Export option that allows you to download the current view (all rows or filtered rows) in CSV or PDF format. Export is intended for reporting or record‑keeping and does not affect alert behavior, investigation, or response workflows.
How alerts are opened
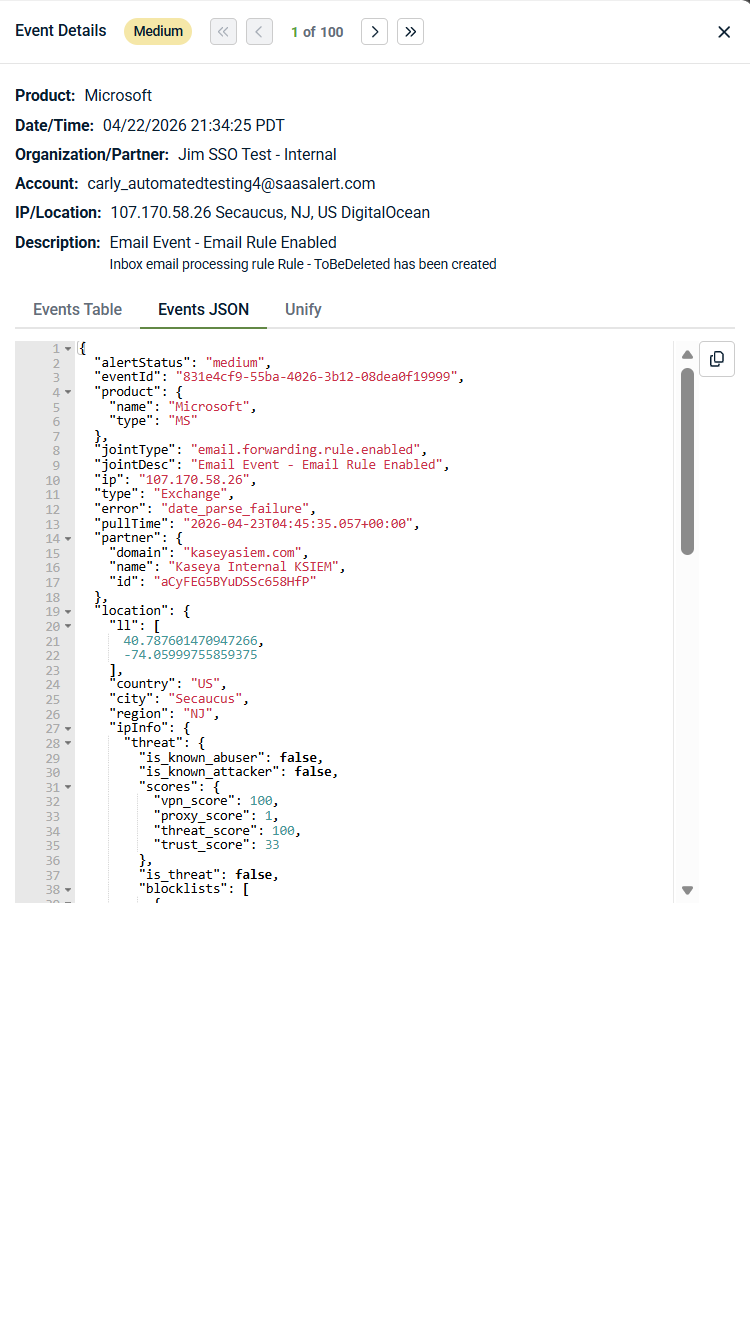
To open the details for a specific alert, select the Show event details (magnifying‑glass) icon in the alert row. This opens the alert details view, where review and investigation begin.
When you open an alert by selecting the Show event details (magnifying‑glass) icon, the alert details surface provides summary information and initial context to help you decide whether deeper investigation is required.
At the top of the alert details, you see a summary of the alert, including:
-
The product that generated the activity
-
Date and time of the event
-
The affected organization or partner
-
The account, user, or identity involved
-
IP address and geographic location (when available)
-
A description explaining why the alert was generated
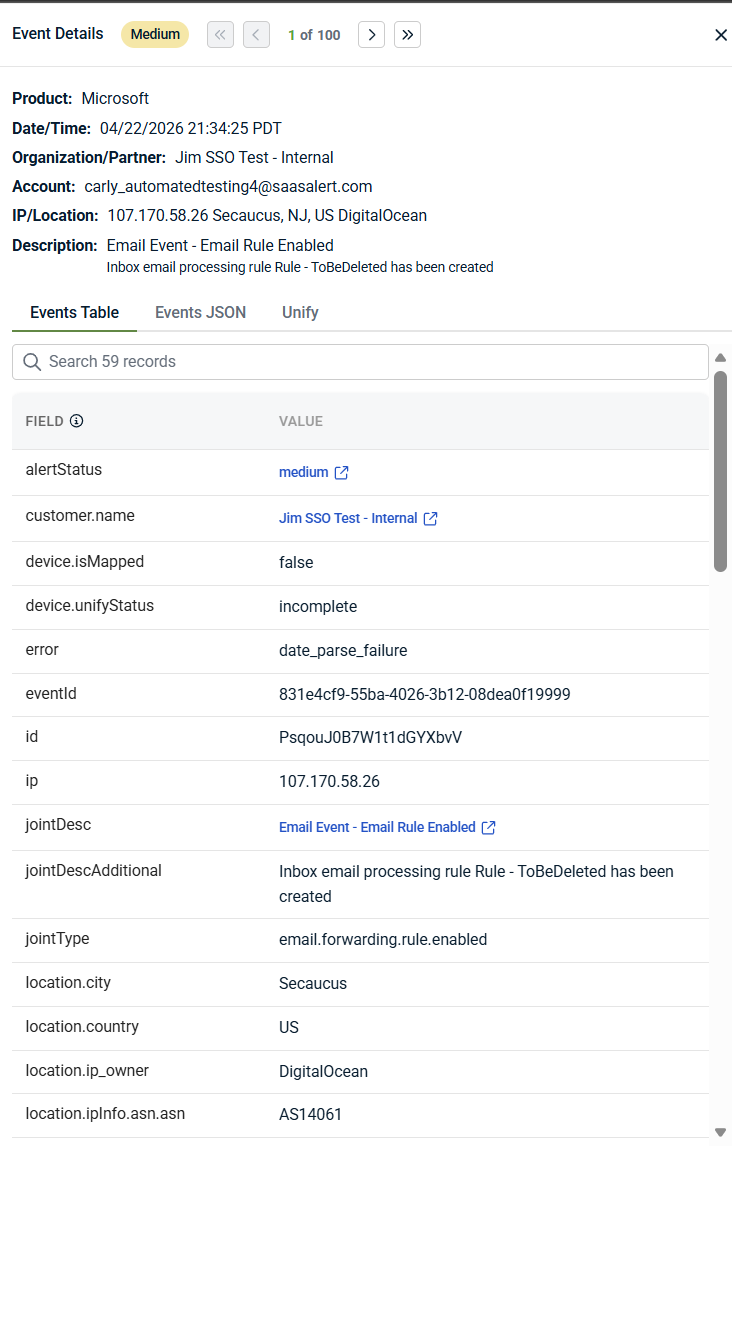
Depending on the detection source, the description may include additional technical or source‑specific details—such as event identifiers, detection metadata, or incident context—to help explain why the activity was flagged.
This summary helps you quickly understand what happened and why the alert exists before reviewing supporting details elsewhere in the alert.
Below the summary, the alert details are organized into multiple views that provide different levels of context:
-
Events Table: Shows alert data in a structured field‑and‑value format, as illustrated in the Events Table view above. Use this view to review key attributes—such as users, devices, event metadata, and identifiers—in a readable layout.
-
Events JSON: Shows the event data in JSON format, reflecting the source‑provided payload and associated metadata. This view is useful when you need exact field names, vendor‑specific attributes, or deeper technical detail that is not surfaced elsewhere in the interface.
-
Unify: Shows how the event was correlated (or not correlated) to related entities such as devices or users. When Unify is active, this view indicates whether correlation was successful and highlights required data points that were not available when mapping could not be completed. When Unify is not enabled or the required data is not available, this view explains how correlation works and why mapping could not be completed. Detailed information about Unify configuration, behavior, and requirements is covered in Configuring Unify.
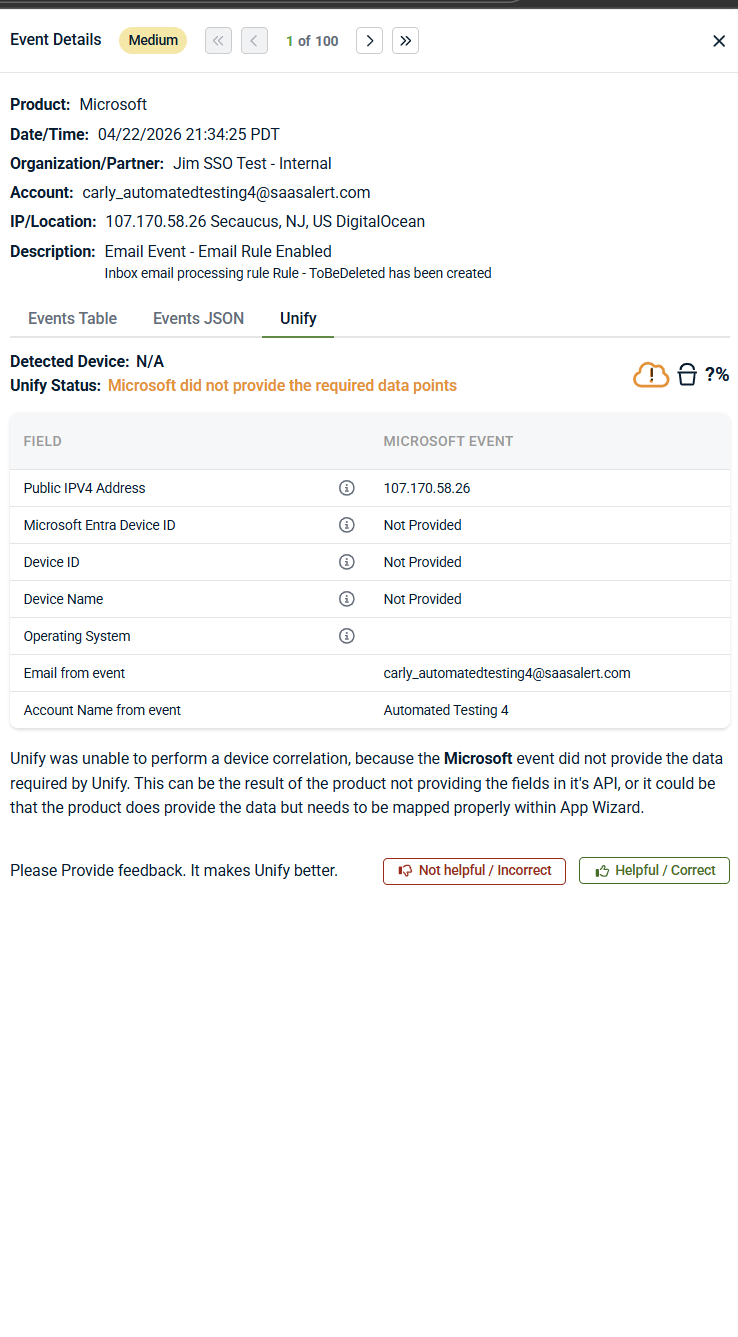
Not all alerts include full device or identity context. Missing or incomplete correlation does not invalidate the alert—it indicates that the source event did not provide all required data.
Some values in the alert details are interactive and can be used to pivot into deeper investigation when additional context is needed. Selecting a blue, linked value—such as alert status or customer name—opens the Analysis page with relevant filters already applied.
For example, selecting alert status opens the Analysis page with the corresponding status filter pre‑populated, allowing you to review related activity across the selected time range without manually building a query. This provides a fast way to move from alert review into deeper investigation when additional context is needed.
As mentioned, you can also open the Analysis page directly from the alert by selecting the Analysis icon, which takes you to the same investigation view with context preserved.
At this stage, you are answering one question: Does this alert require deeper investigation right now? If the alert summary and available context are sufficient to understand the activity, no immediate action may be required. If not, continue investigation using the Analysis page. For step‑by‑step guidance on investigating alerts and reviewing correlated activity, see Investigating alerts using the Analysis page.
This review step is about understanding context and limitations, not taking action.
A first‑pass alert review checklist
When you open an alert in Kaseya MDR for the first time, start with a quick, structured review before deciding whether deeper investigation is needed:
-
Why did this alert fire?: Read the alert description and summary to understand what condition was detected
-
Who or what is involved?: Note the users, devices, services, or identities referenced in the alert
-
When did the activity occur?: Check timing and sequence to see whether the activity appears isolated or ongoing
-
Is any expected context missing?: If correlation is incomplete, note what information is unavailable before drawing conclusions.
-
Does this alert raise unanswered questions?: If the available context fully explains the activity, no immediate investigation may be required. If not, continue investigation using the Analysis page.
This checklist is intended to guide initial review and interpretation, not to dictate response or automation decisions.
Deciding your immediate next step
Use alert severity as a prioritization signal, not a response mandate.
Alert severity reflects the urgency and potential impact of the detected activity, based on detection logic and available context at the time the alert was generated. Severity helps prioritize review, but it does not determine outcomes on its own.
In general:
-
Critical alerts indicate high‑risk or unusual activity that typically warrants prompt investigation.
-
Medium alerts indicate suspicious or noteworthy behavior that should be reviewed to determine whether investigation is needed.
-
Low alerts indicate lower‑risk or informational activity that may be useful for visibility, correlation, or supporting other investigations.
Severity does not confirm intent, impact, or compromise. Every alert should be interpreted in context before deciding on investigation or response.
| Severity | Typical next steps |
|---|---|
| Critical | Proceed to investigation promptly |
| Medium | Review context and investigate if behavior is unexpected |
| Low | No immediate action; retain for visibility or investigation support |
Do not tune, suppress, or dismiss alerts before investigating at least one representative example. For a step‑by‑step workflow that starts from a real alert and leads into scoped suppression, see Suppressing alerts from Events (investigation‑based suppression).
If investigation confirms that response is required, response actions are reviewed and tracked in the response‑focused articles later in this section.
Suppressing alerts and managing noise
Selecting the bell icon opens the Create Event Suppression Rule, a state‑changing action that should be performed only after investigation confirms the activity is expected or low risk.
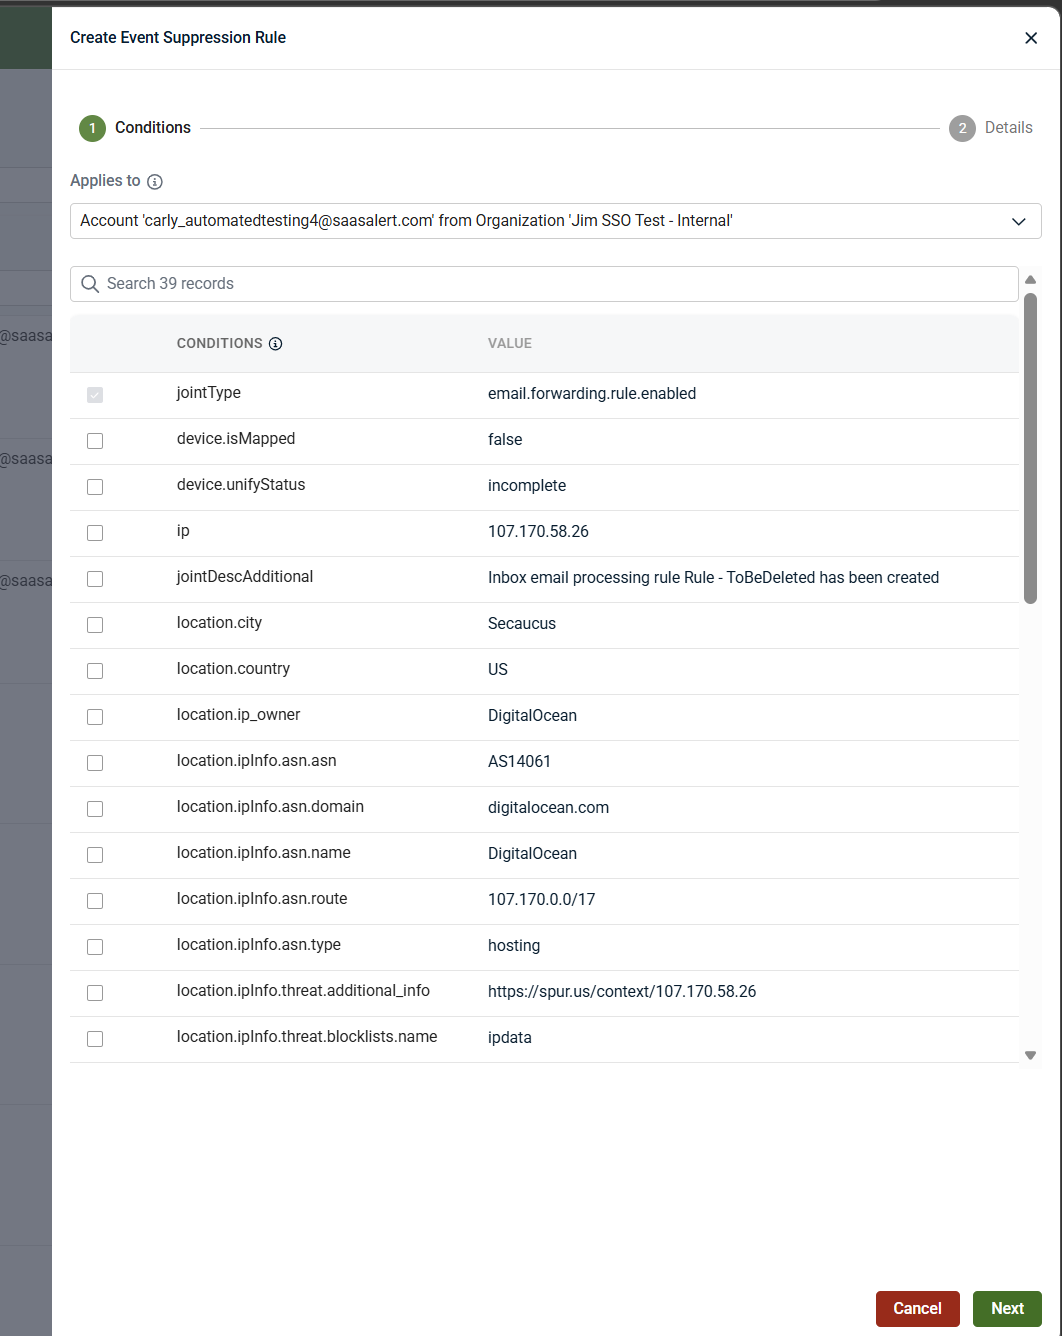
Guidance on when and how to suppress alerts is intentionally covered in Alert suppression and Suppressing alerts from Events (investigation‑based suppression).
Investigating alerts when more context is needed
The Analysis page brings together:
-
Correlated activity across endpoints, network infrastructure, and SaaS applications
-
Timelines that show sequence and progression
-
Related entities such as users, devices, IP addresses, or services
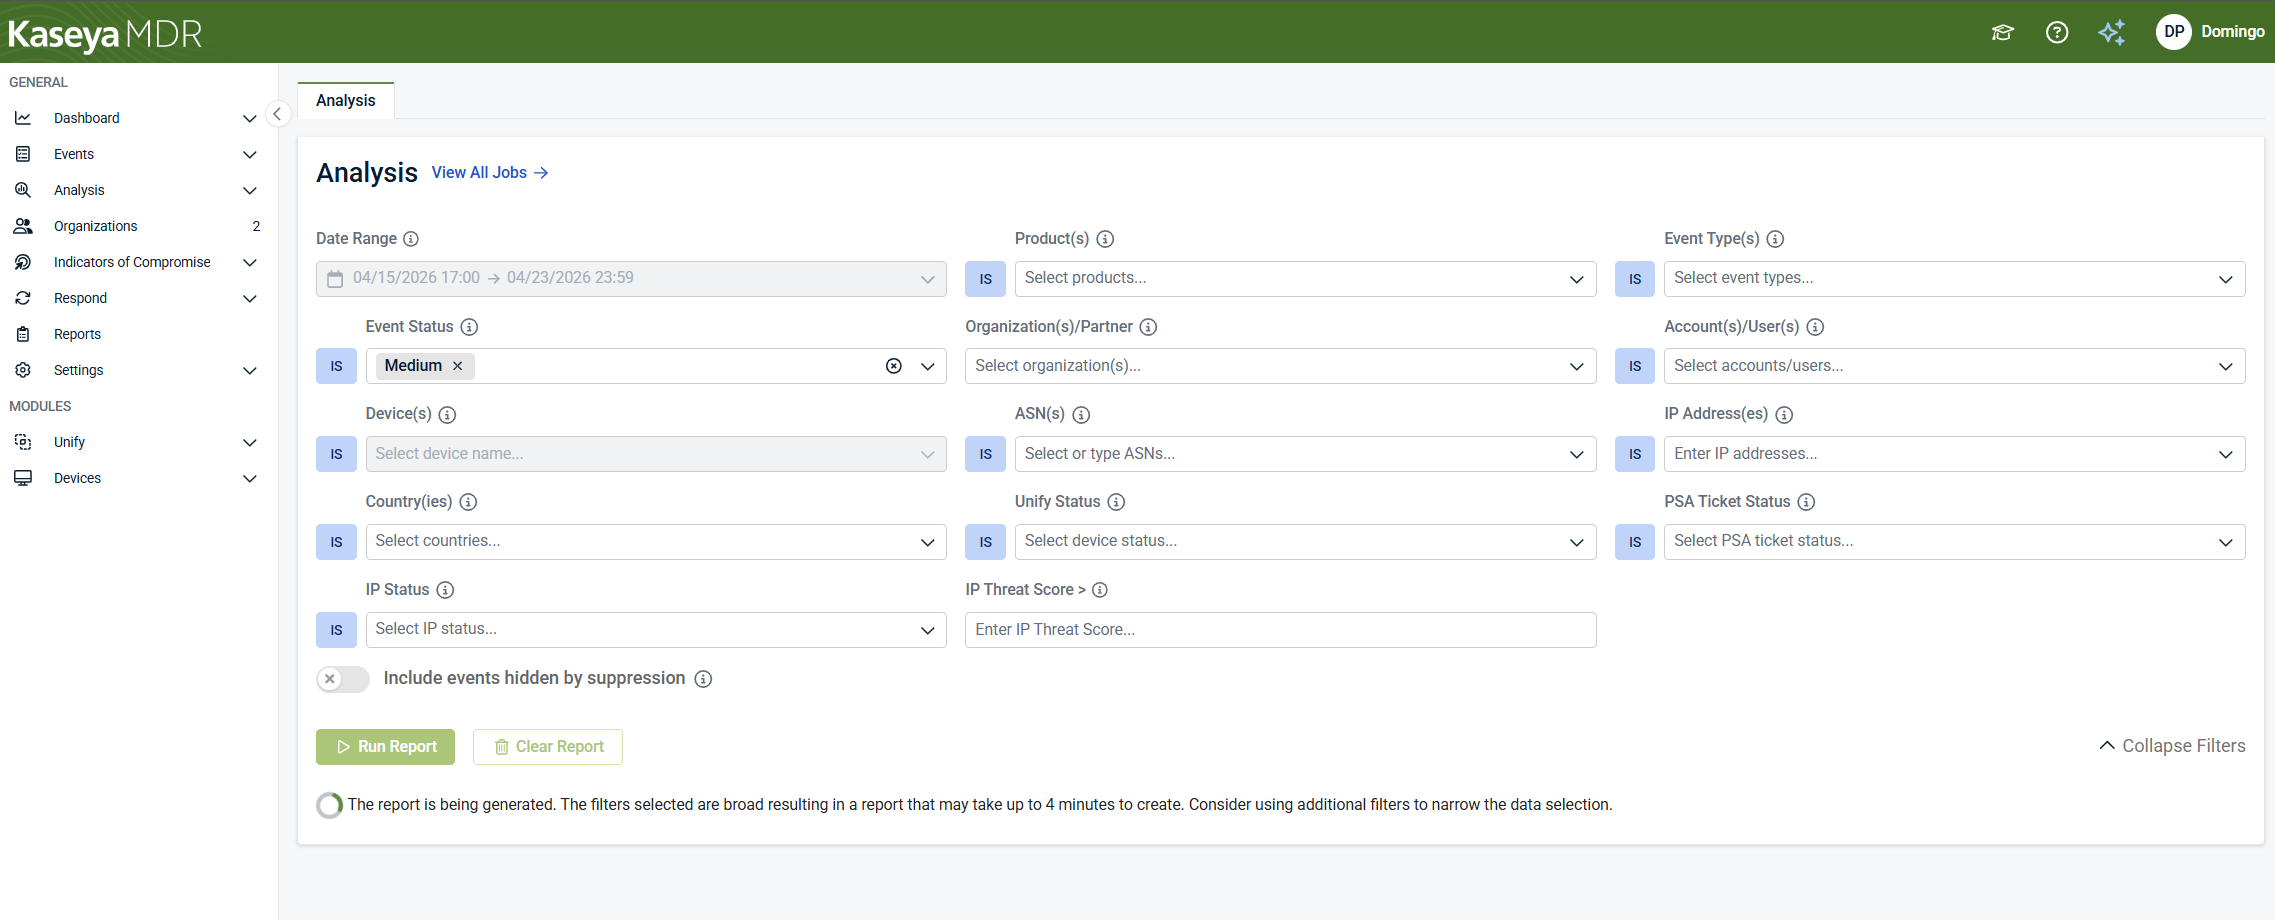
IMPORTANT In Kaseya MDR, investigations typically begin with alerts. Use the Analysis page as a targeted deep‑dive tool when you have a specific question to answer, such as validating scope, understanding related activity, or confirming whether behavior is expected.
What not to do when working with alerts
When reviewing alerts:
-
Do not assume a Critical alert confirms malicious activity
-
Do not take action before understanding investigation context
-
Do not ignore Medium alerts without review
-
Do not treat Low alerts as irrelevant
This review step is about understanding context, not action. If deeper context is required, continue with Investigating alerts using the Analysis page.
If investigation confirms repeated or low‑risk behavior, see Managing noise and signal to decide how future alerts should behave.
Related articles
-
Investigating alerts using the Analysis page: Perform deeper, correlated investigation when alert context is insufficient. Learn how to validate scope, timeline, and related activity using the Analysis page
-
Managing noise and signal: Decide when and how to change alert behavior after investigation, including severity tuning and noise‑reduction strategies that preserve investigative visibility
-
Managing repeated alerts: Review and handle alerts that fire frequently due to expected behavior. Learn how to reduce repeated alert noise safely after investigating representative examples


