Investigating activity using the Analysis page
The Analysis page is the primary investigation workspace in Kaseya MDR. It provides a single, correlated view of alerts and related activity across your environment so you can understand what happened, how activity is connected, and whether behavior is expected or represents a security risk.
Instead of reviewing individual alerts in isolation, the Analysis page lets you investigate devices, users (when applicable), IP addresses, and related activity together in one searchable view. This is where investigation and validation decisions are typically made before response actions are taken.
If the Dashboard answers What needs attention?, the Analysis page answers What actually happened?
How alert behavior decisions fit together
Use the articles in this section together as a deliberate decision ladder:
-
Start with the alert
Review the alert and understand what it represents before taking action.
-
Investigate before changing behavior
Use the Analysis page to validate context, scope, and impact.
-
Decide how (or whether) alert behavior should change
Determine whether tuning, suppression, or no action is appropriate based on investigation results.
-
Apply the selected change in the correct place
Severity or detection tuning > global prioritization changes.
See: Managing alert severity and detection tuningSuppression rules > scoped exceptions for specific conditions.
See Suppressing alerts from Events; Alert suppressionEach article in this set is intentionally scoped to one step in this process.
Avoid skipping steps. Changing alert behavior without investigation can hide meaningful security activity and reduce confidence in response decisions.
When to use the Analysis page
Use the Analysis page whenever you need deeper context than the dashboard or an individual alert provides, including when you want to:
-
Investigate an alert in detail
-
Understand activity before and after a detection
-
Validate whether activity is benign, suspicious, or malicious
-
Investigate a specific user, device, IP address, network, or organization
-
Review low‑severity or suppressed activity
-
Confirm scope and impact before initiating response actions
The purpose of investigation in the Analysis page is to determine whether the observed activity is expected, suspicious, or requires response before any action is taken.
How the Analysis page works
Kaseya MDR is built around the idea that meaningful investigations require correlation, not just isolated events.
The Analysis page works by:
-
Normalizing telemetry collected by Kaseya MDR
-
Correlating related activity across time, entities, and detections
-
Presenting results in a single, searchable investigation table
This approach allows you to see what occurred before, during, and after an alert, helping you determine whether activity is isolated or part of a broader incident.
Accessing the Analysis page
-
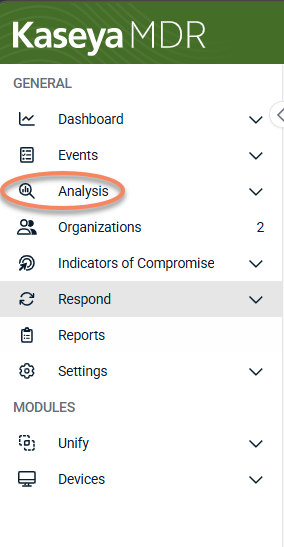
From the side navigation menu, click Analysis.
-
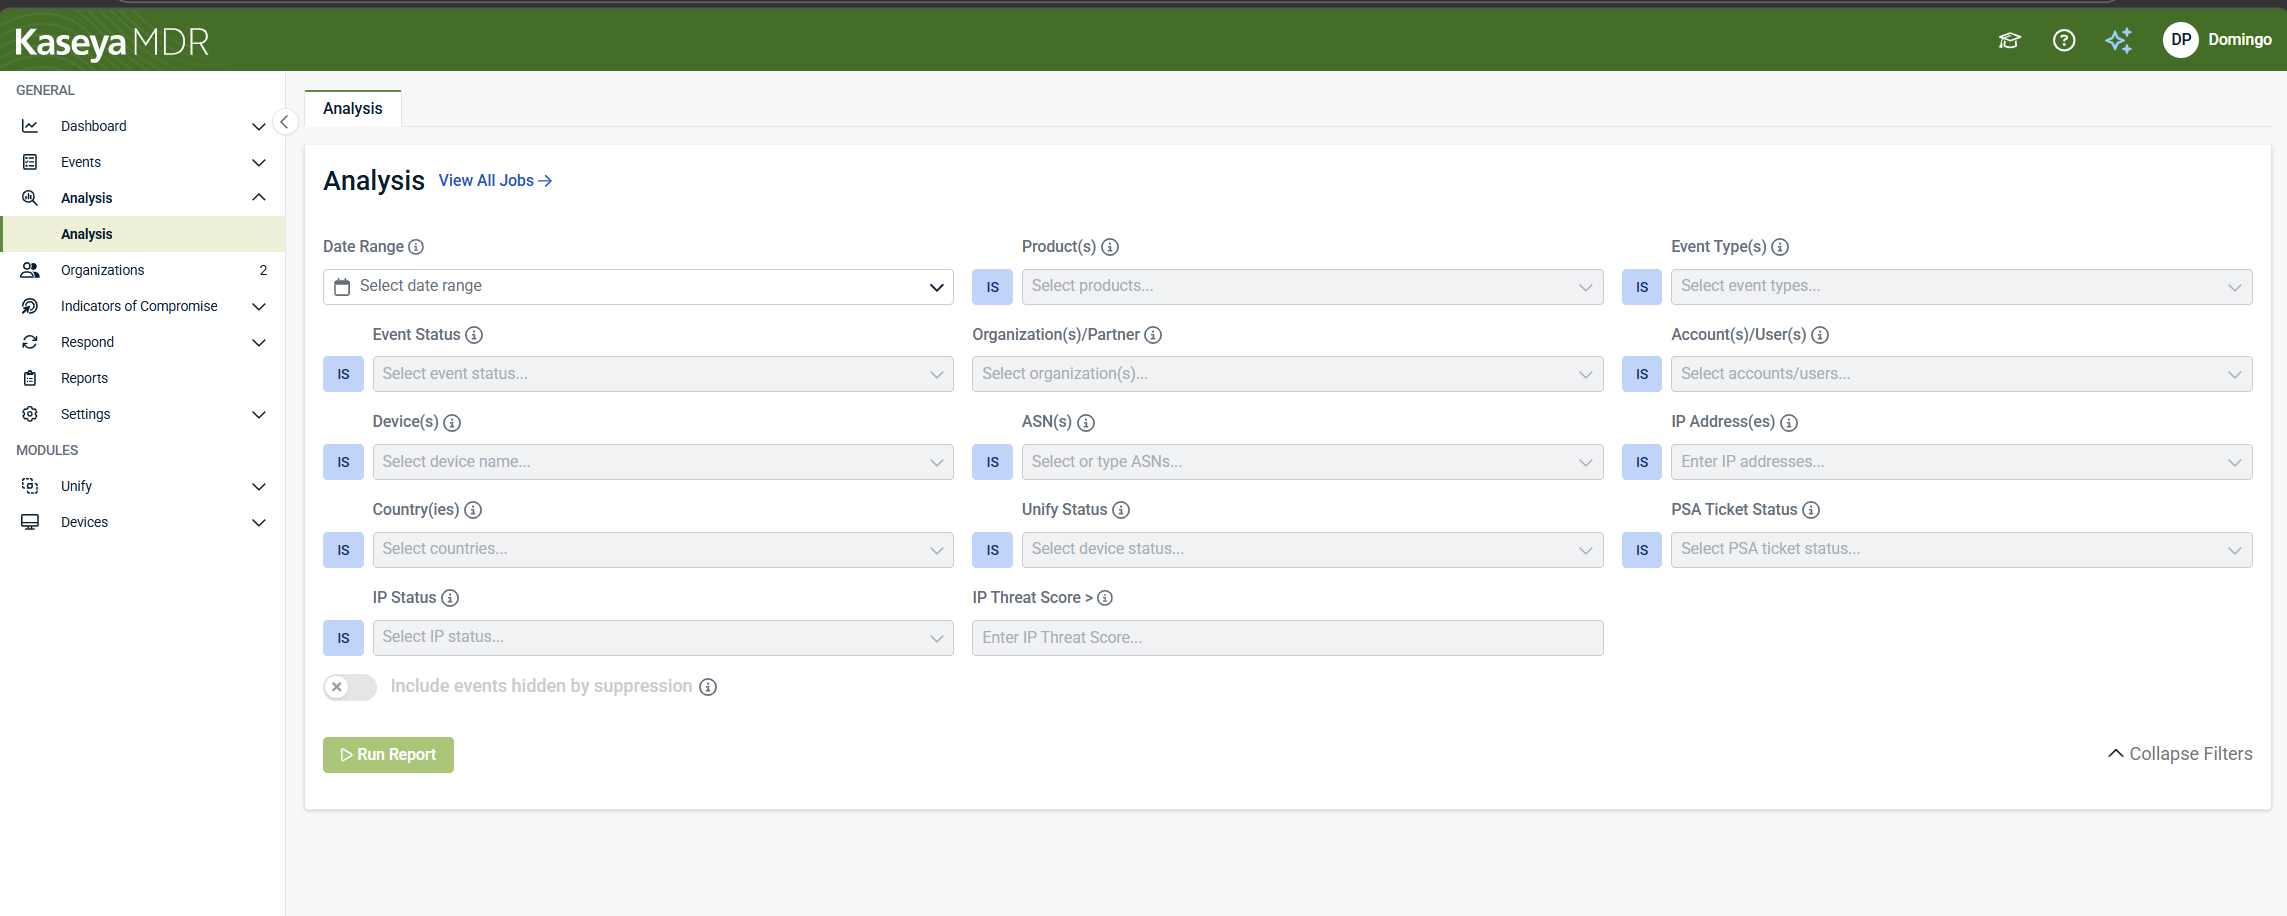
The Analysis page opens with:
-
A filter panel at the top
-
A results table below (empty until a report is run)
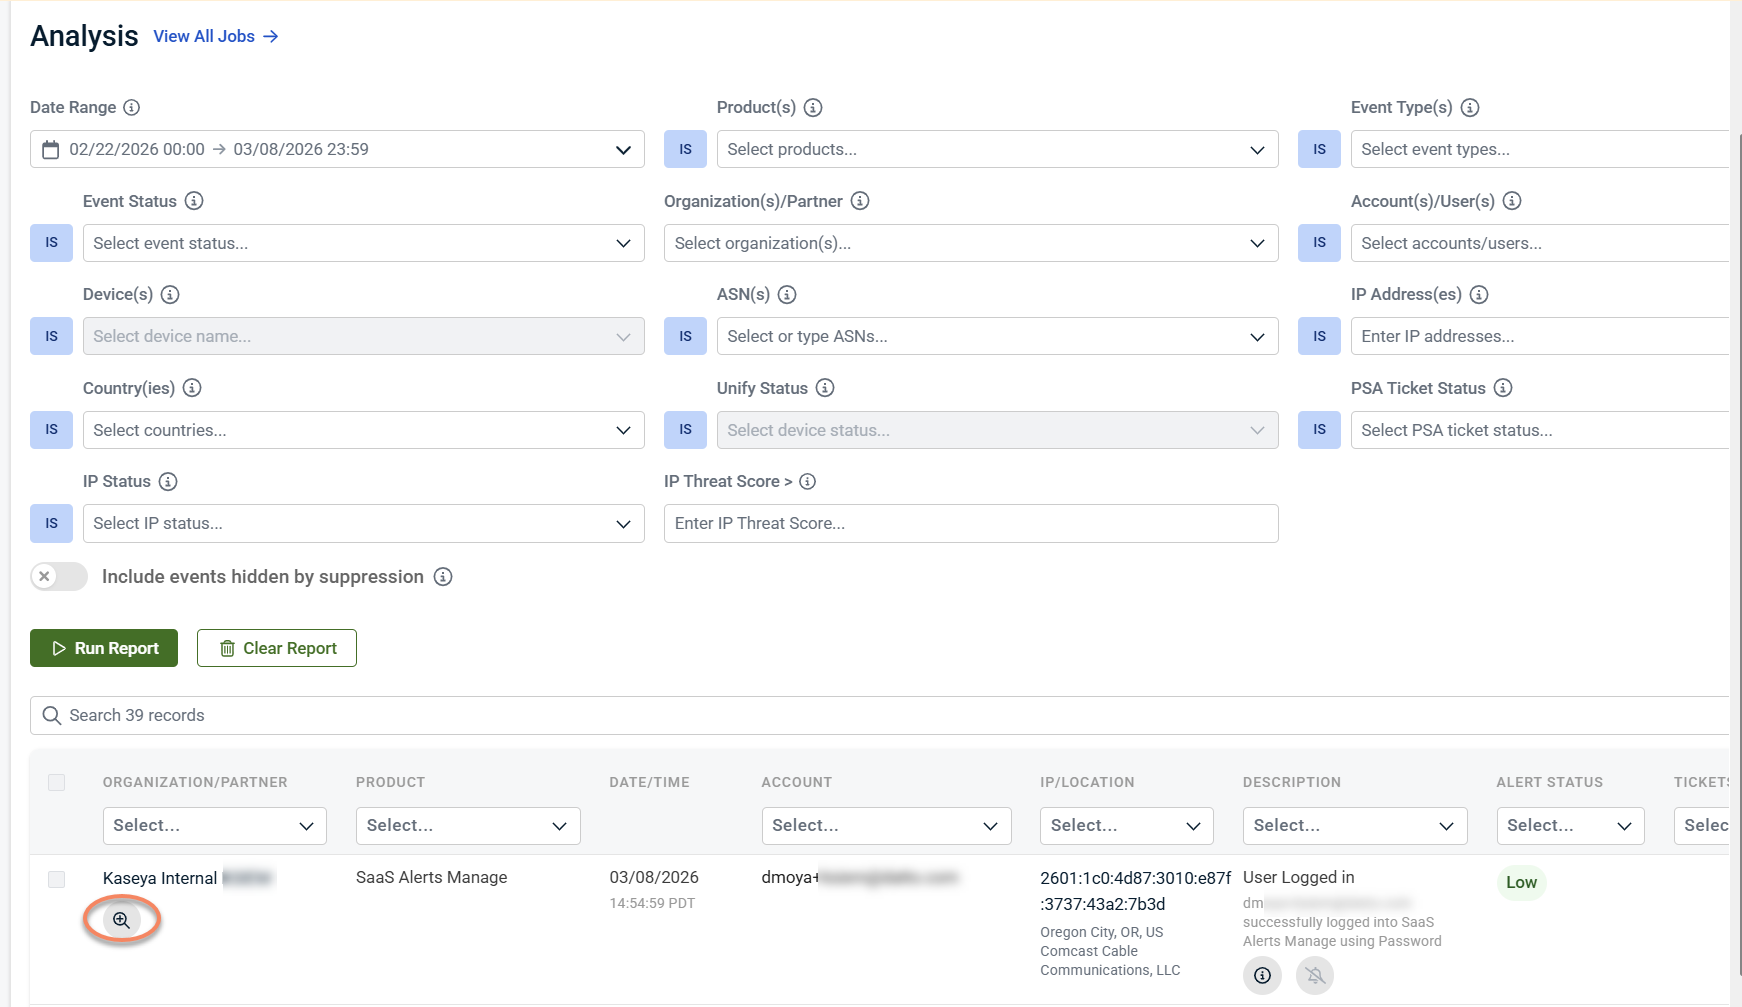
Running an investigation
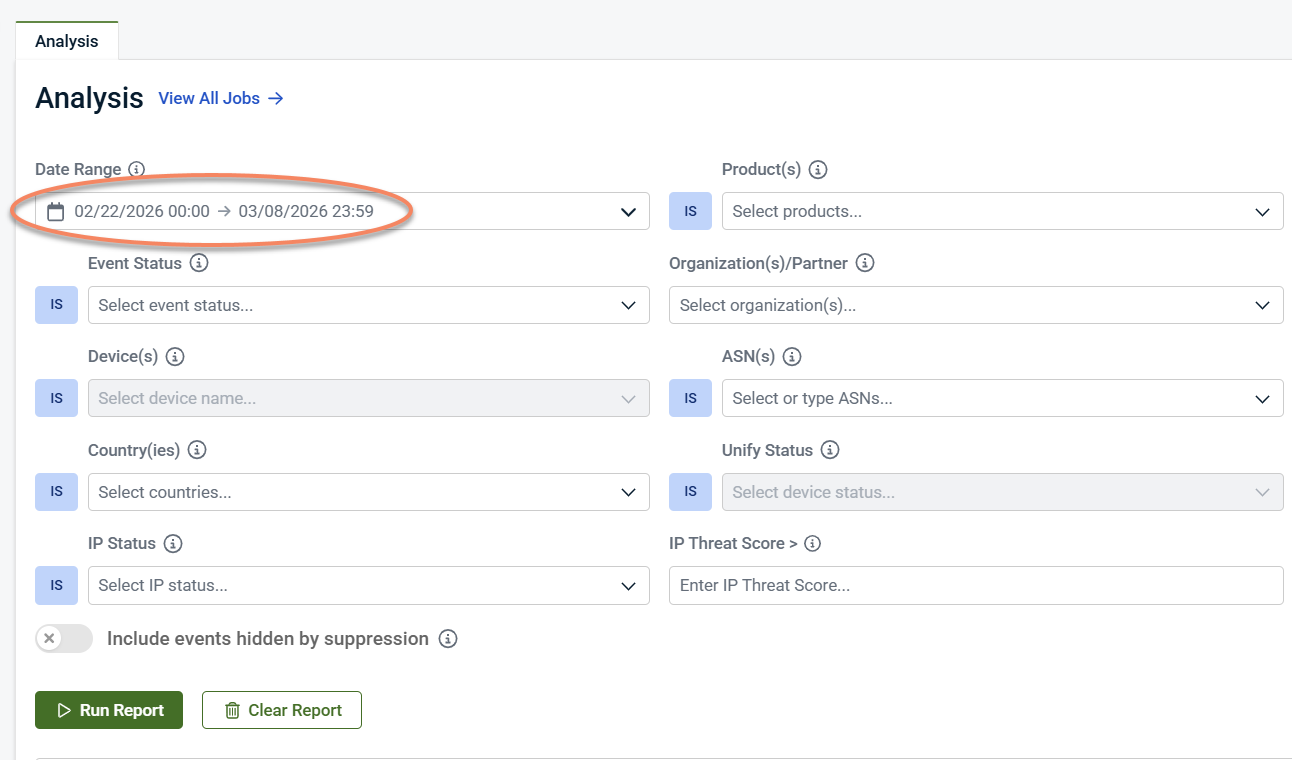
Investigations are performed by defining scope in the filter panel and running a report.
Use the Date Range selector to define the time window for your investigation.
NOTE Future dates are not allowed. The maximum lookback period is 400 days.
You can define the date range using one of the following methods:
Option A: Quick select
Use Quick select to choose a predefined time range, such as:
-
Last 15 minutes
-
Last 1 hour
-
Last 12 hours
-
Last 24 hours
-
Last 7 days
-
Last month
-
Last 6 months
-
Last 1 year
This option is useful for quickly reviewing recent activity.
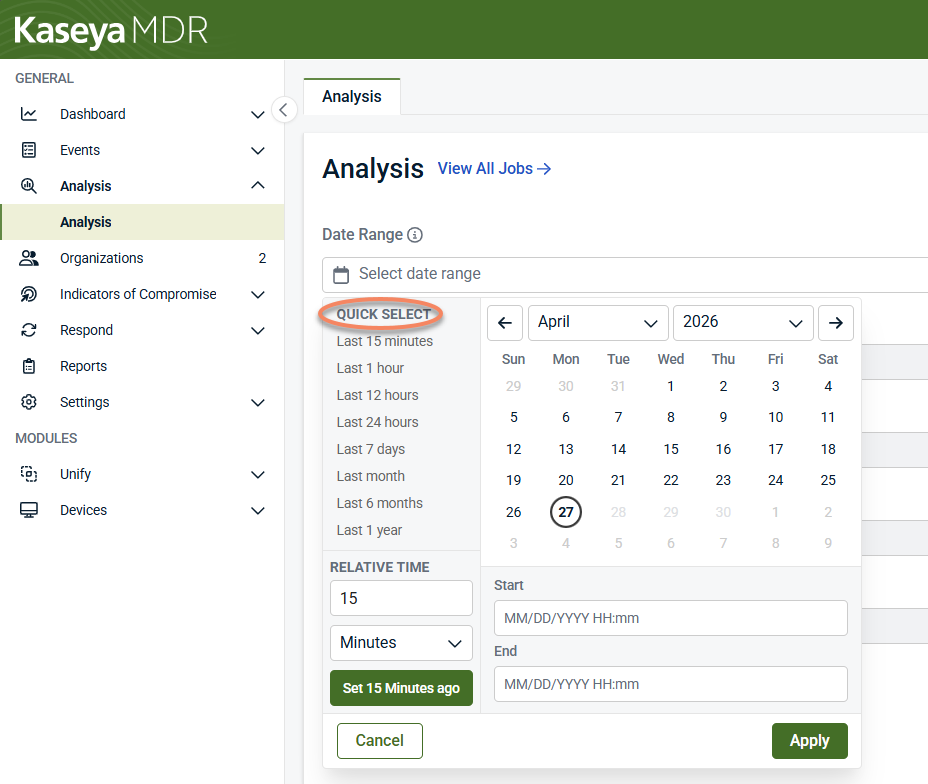
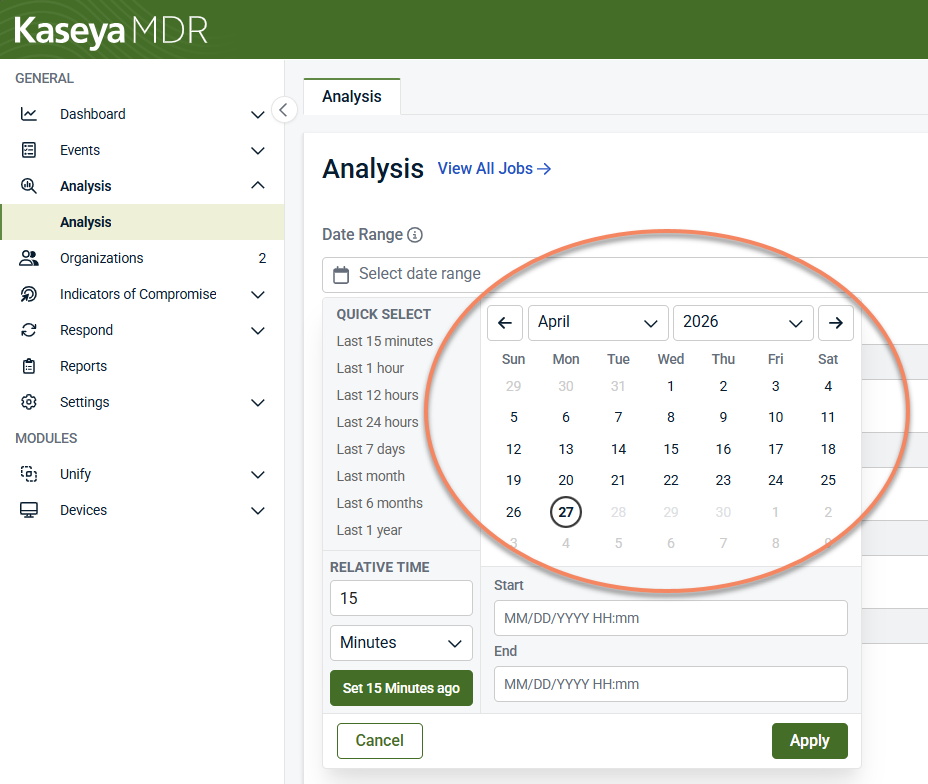
Option B: Calendar-based range
Use the calendar to select a specific start and end date and time:
-
Navigate to the desired month and year.
-
Select a Start date and time.
-
Select an End date and time.
This option is best when investigating activity around a known alert, incident, or time period.
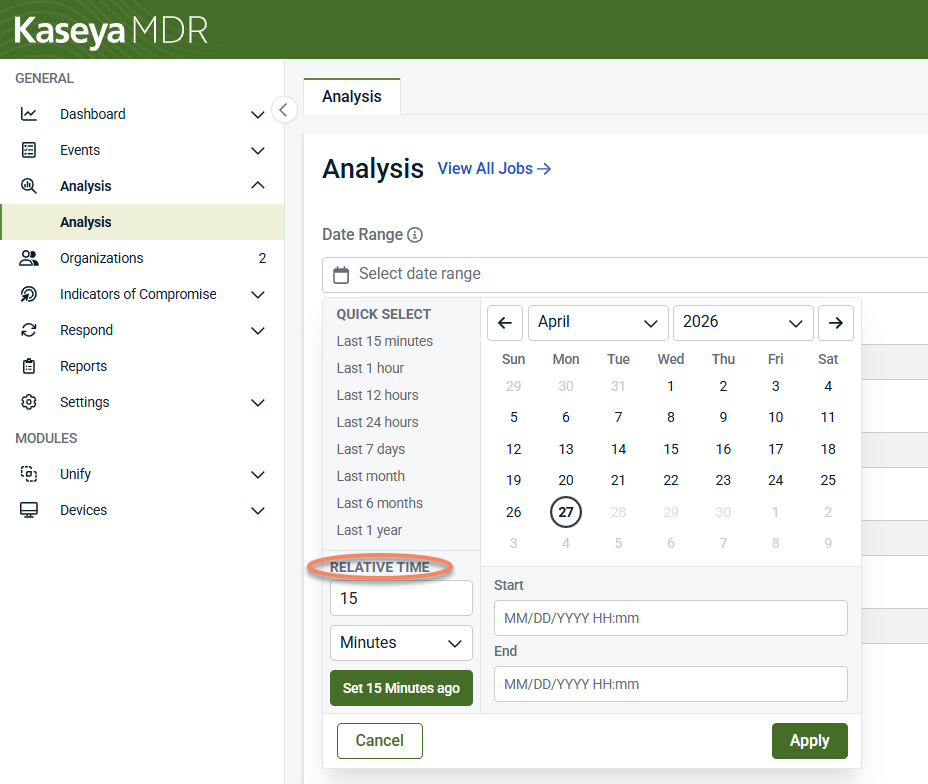
Option C: Relative time
Use Relative time to define a rolling time window (for example, activity from the last 15 minutes):
-
Enter a numeric value.
-
Select the time unit (Minutes, Hours, or Days).
-
Click Set <time> ago.
Relative time is useful for ongoing or repeated investigations.
Apply the date range
After defining the date range, click Apply to set the investigation window.
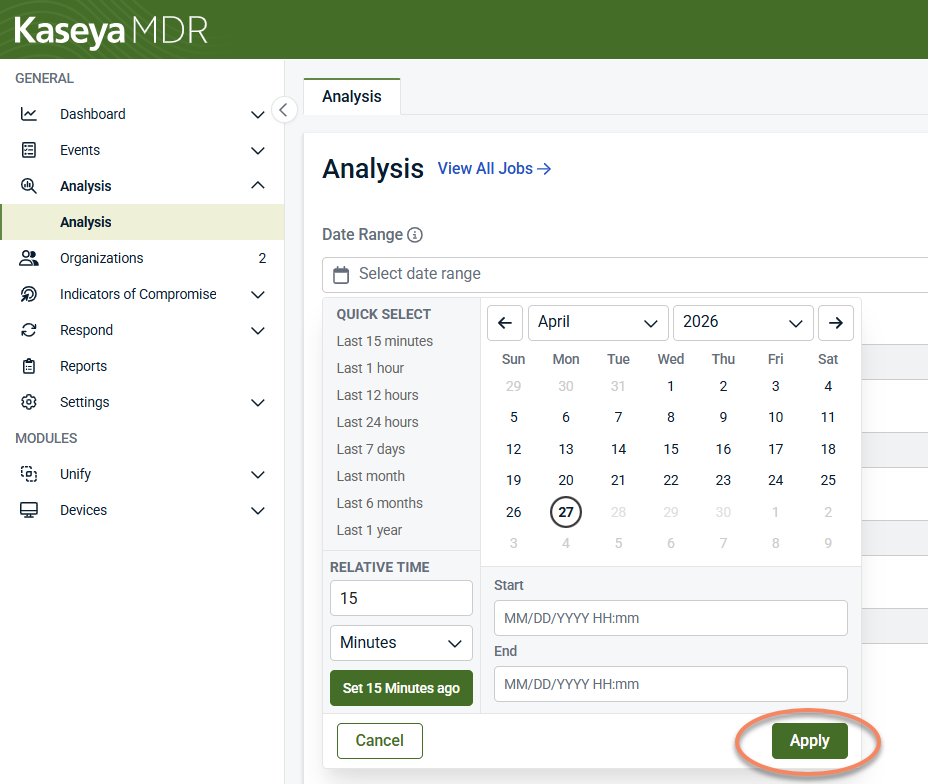
Best practice: Start with a narrow time (for example, 15–60 minutes around an alert), then expand only if additional context is needed.
Although broad searches are possible, scoping your investigation is strongly recommended.
At a minimum, select an Organization / Partner. Then add one primary subject based on your investigation goal:
-
Account / User: identity‑centric investigations
-
Device: host‑based investigations
-
IP Address, ASN, or Country: network‑focused investigations
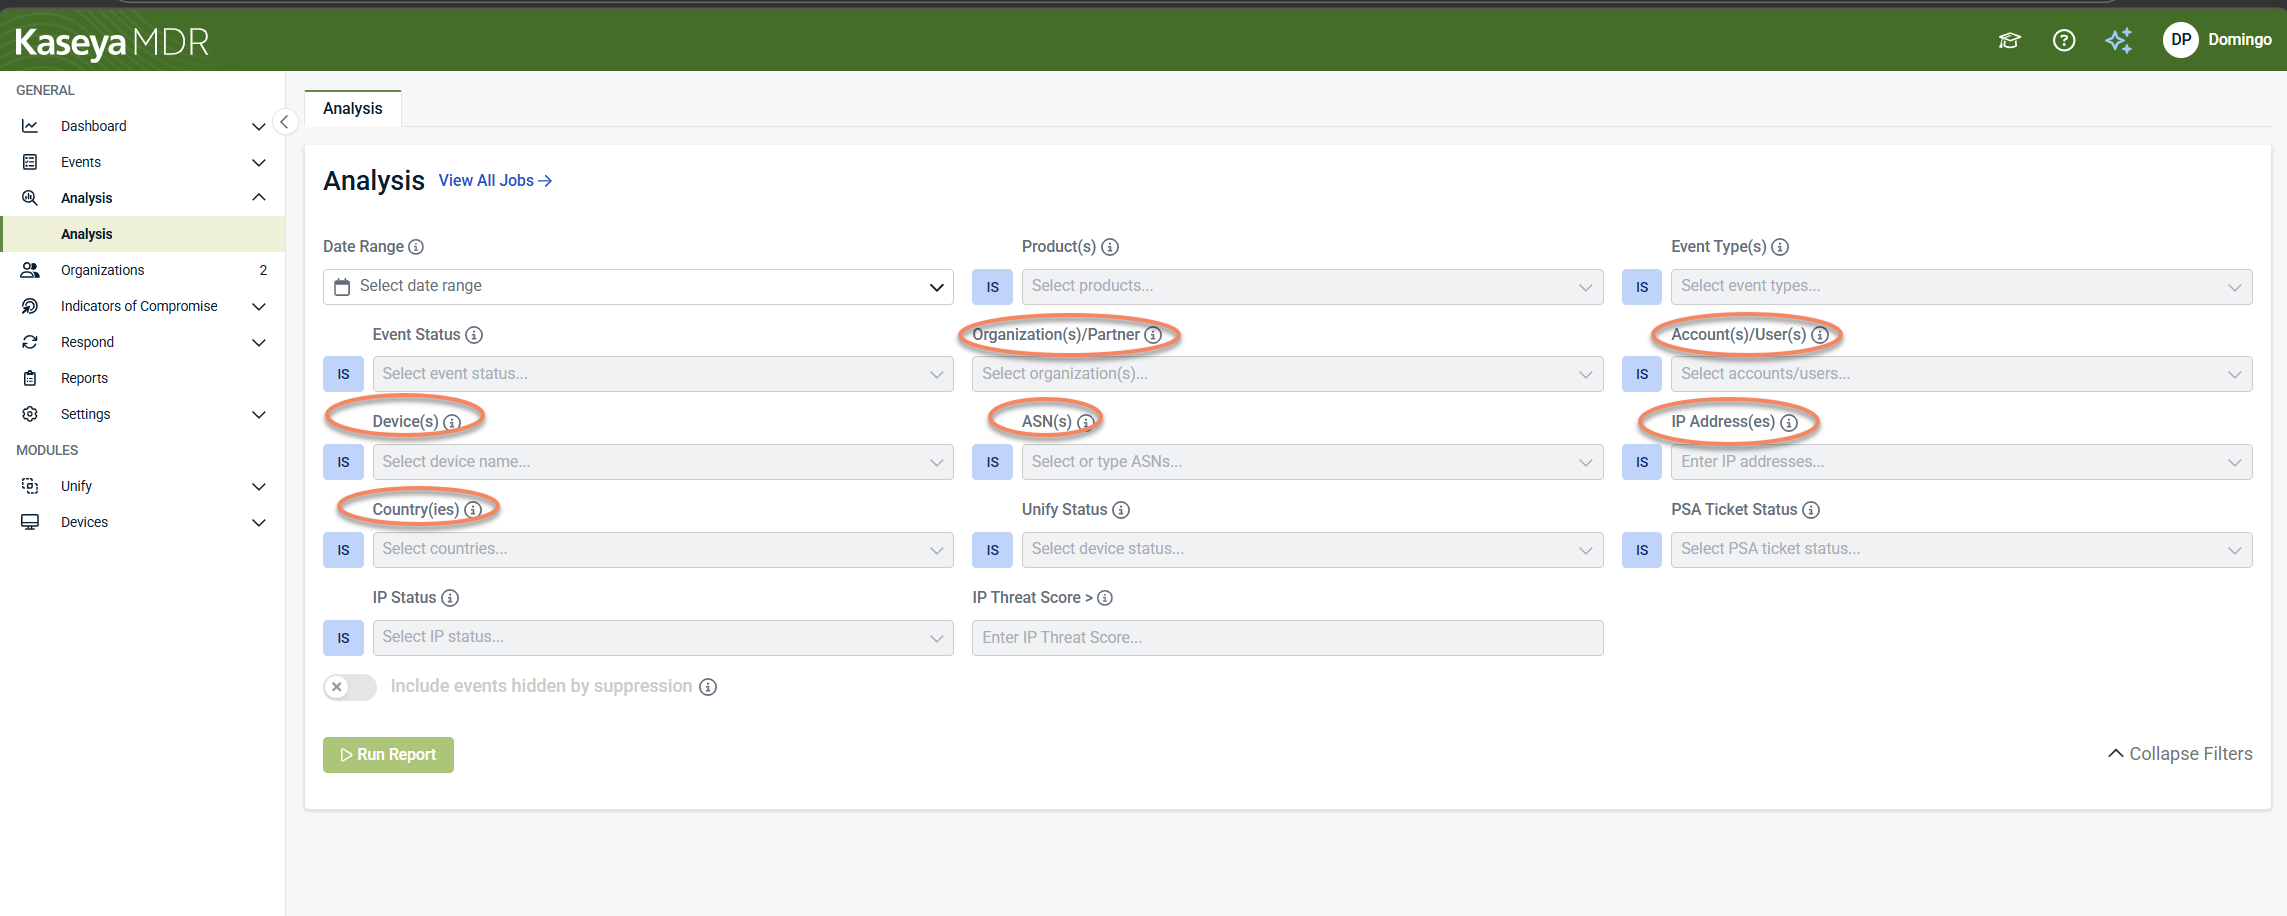
Use additional filters to narrow results while preserving correlation. Common filters include:
-
Product: telemetry source
-
Event Type: category of recorded activity
-
Event Status: alert severity or state
-
PSA Ticket Status
-
IP Status: IP reputation or classification
-
Threat Score: prioritize higher‑risk activity
Filters can be combined and adjusted iteratively as your investigation evolves.
Enable Include events hidden by suppression to include suppressed activity in the results.
This is useful when:
-
Reviewing why alerts were suppressed
-
Investigating activity around a false positive
-
Validating alert tuning decisions
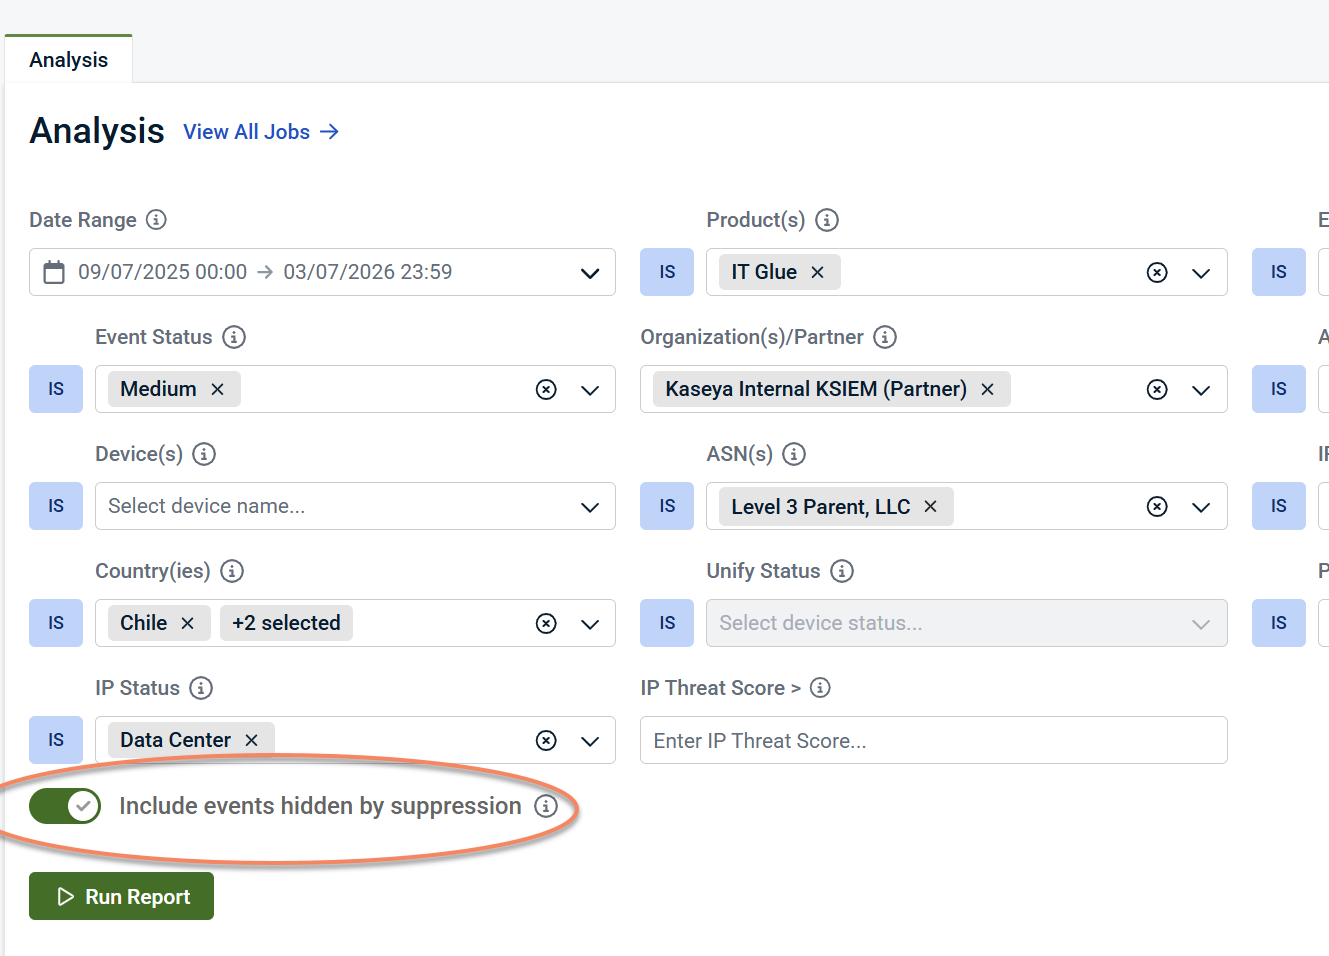
Click Run Report to generate results. The Results table populates with all correlated activity that matches your criteria.
NOTE Reports have a data limit. If a report fails to generate, reduce the date range or apply additional filters and try again.
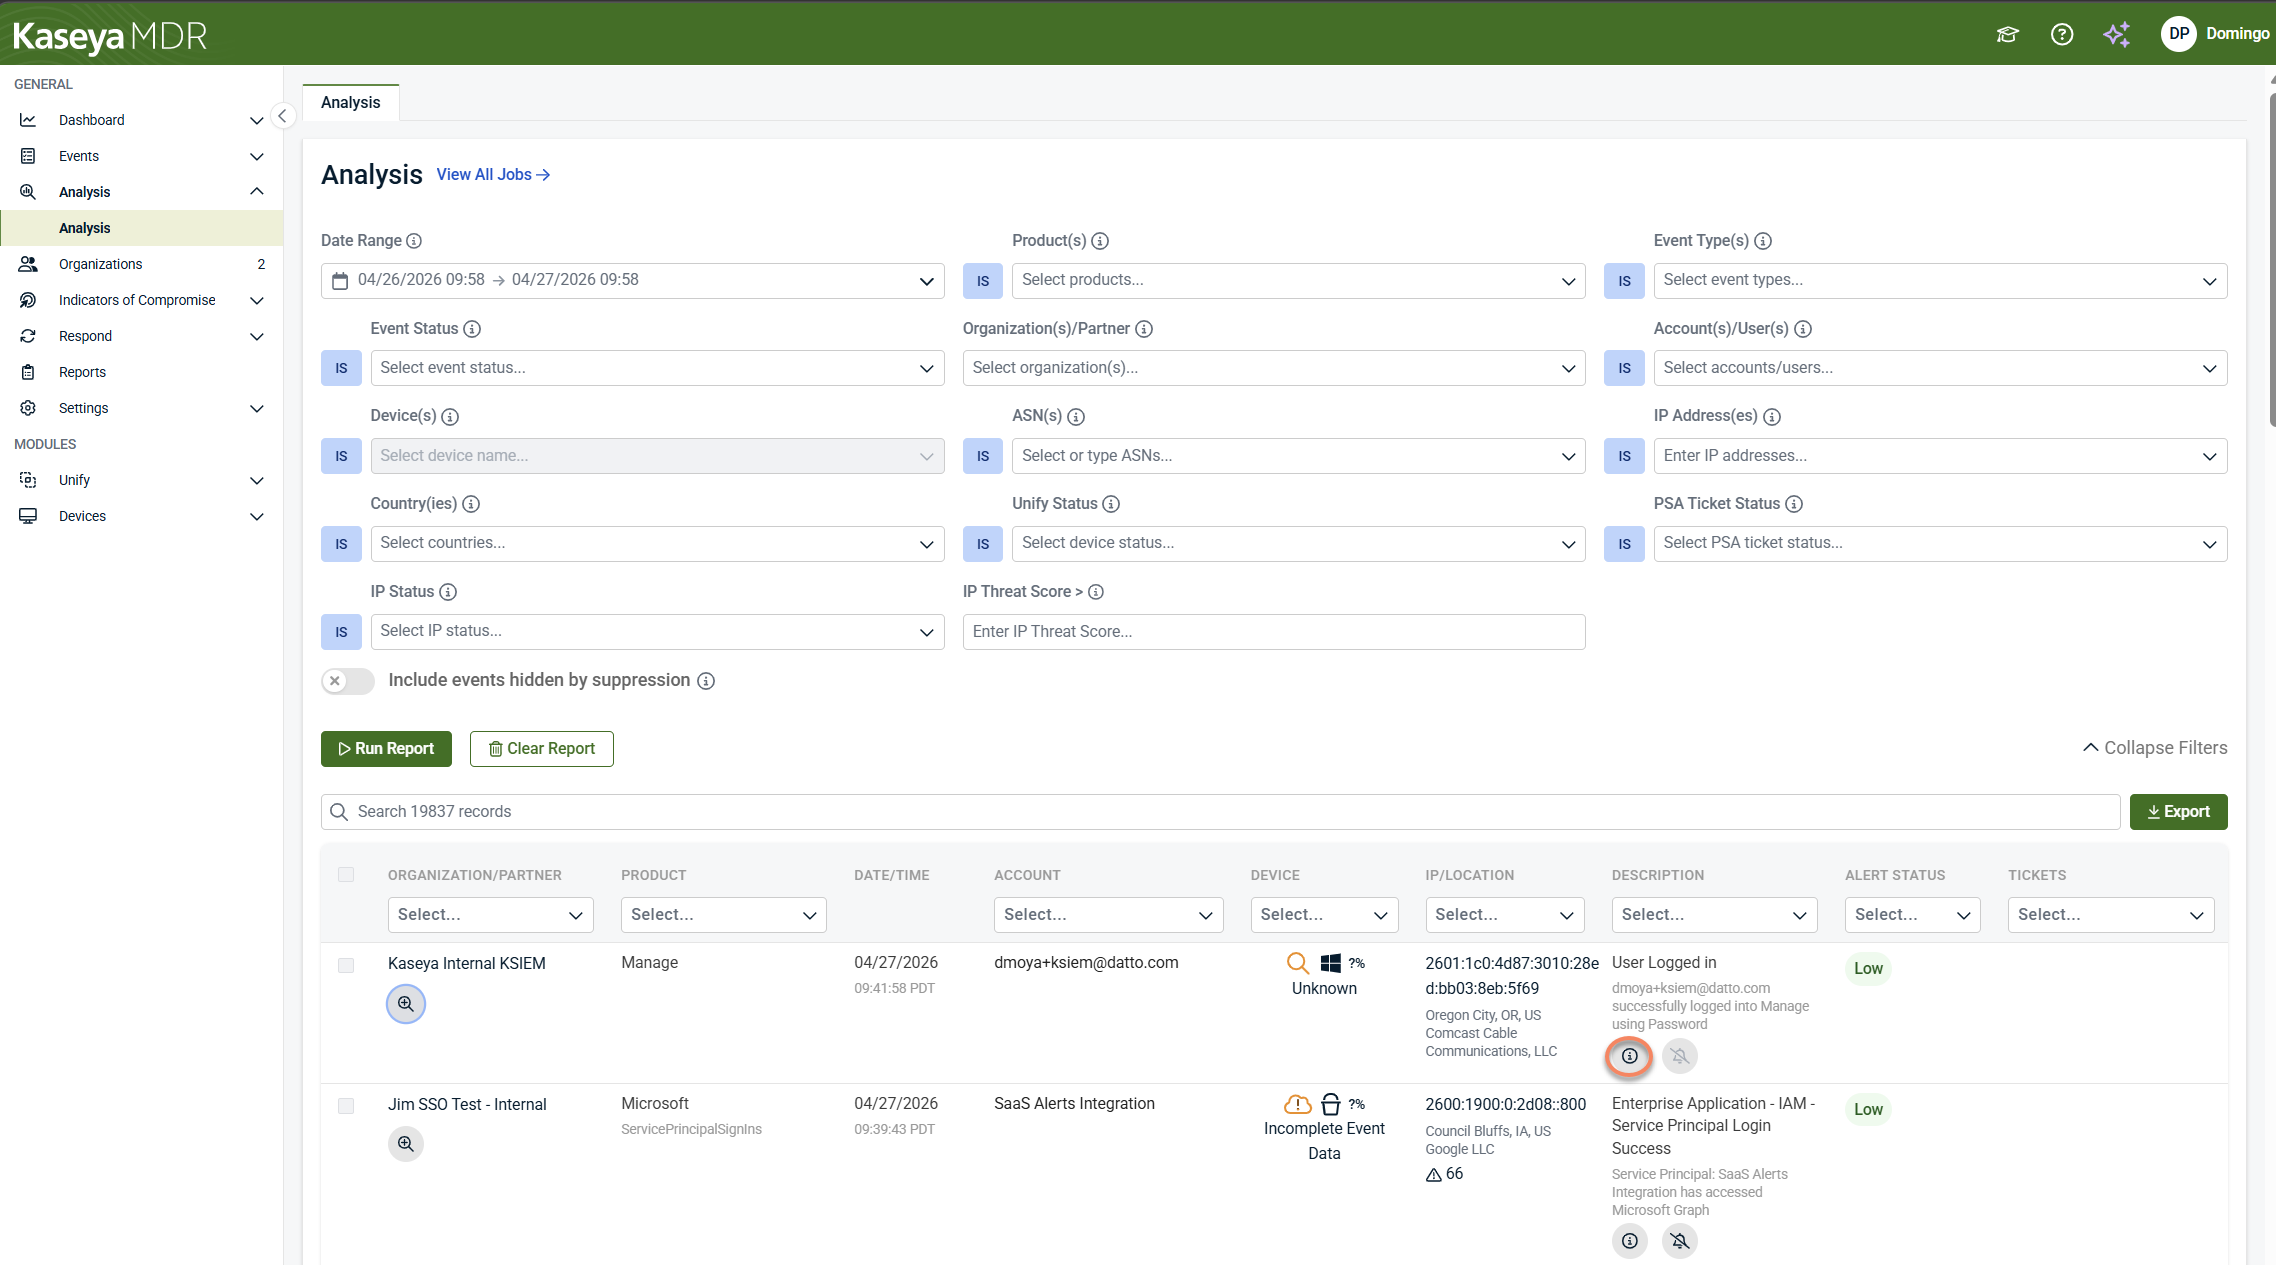
Understanding the Results table
After you click Run Report, the Results table displays all matching alerts and related activity in a single, correlated view.
Each row represents a single alert or a related activity record correlated for investigation. Results are normalized so activity from different products can be reviewed together without switching views.
-
Search bar: Search across all displayed results by user, device, IP address, or text in the description.
-
Inline column filters: Each column includes a Select… filter that lets you refine results immediately without re‑running the report.
-
Sortable columns: Click column headers (for example, Date/Time) to sort results and review activity chronologically.
-
Export: Download the current result set for reporting or offline review.
Changes made in the filter panel require re‑running the report. Changes made using column filters apply only to the currently displayed results.
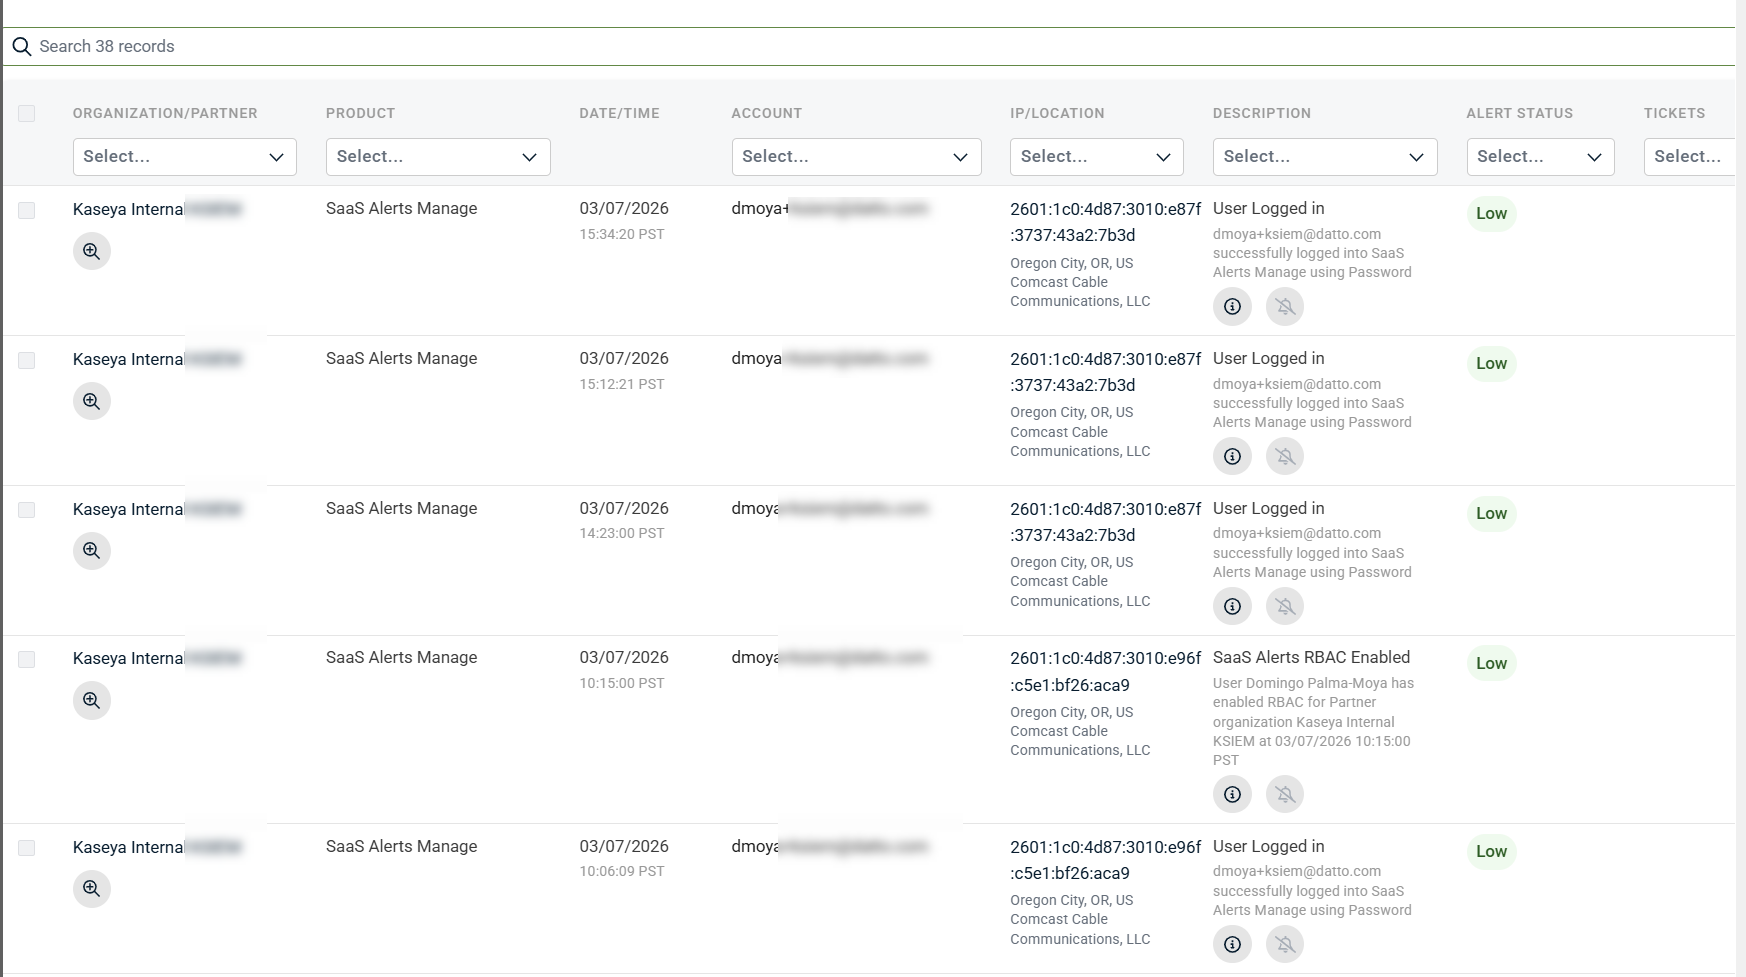
Depending on your data and filters, the table may include:
-
Organization / Partner: Tenant associated with the activity
-
Product: Source of the telemetry
-
Date/Time: When the activity occurred
-
Account: Account associated with the activity, when applicable
-
IP/Location: Source IP address and resolved location
-
Description: Human‑readable summary of the activity
-
Alert Status: Severity or state (Low, Medium, Critical)
-
Tickets: Associated PSA tickets, if applicable
Working with results typically involves identifying relevant activity in the table, reviewing record‑level details, and using recommendations and indicators to determine whether action is required.
You can expand an individual row to view detailed information about that record without leaving the Analysis page.
-
In the results table, click the+ icon at the start of a row.
- TheEvent Details panel opens on the right side of the page.
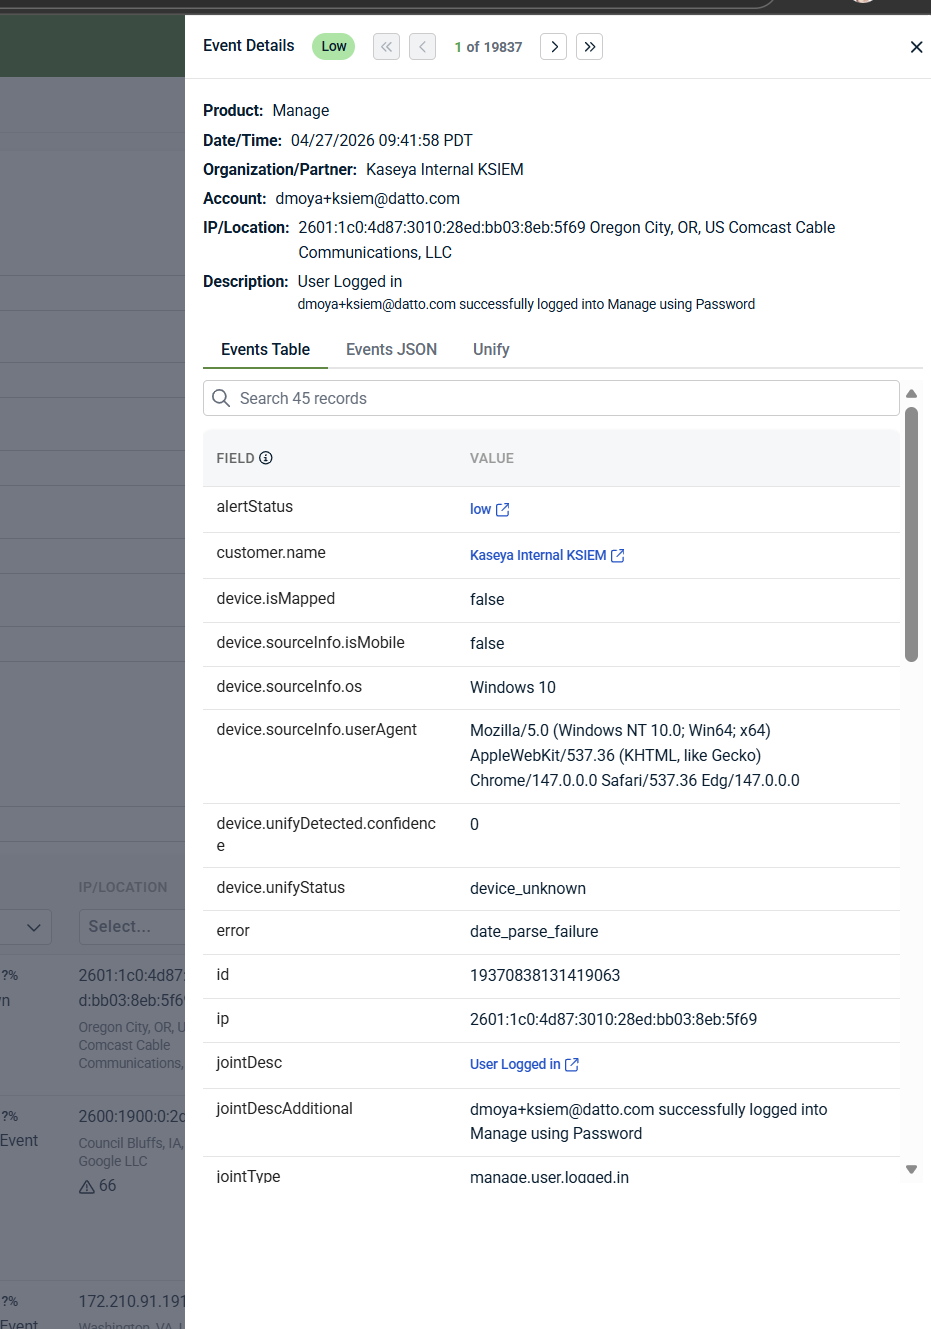
Event Details tabs
The Details panel contains multiple tabs that provide different levels of detail for the selected record.
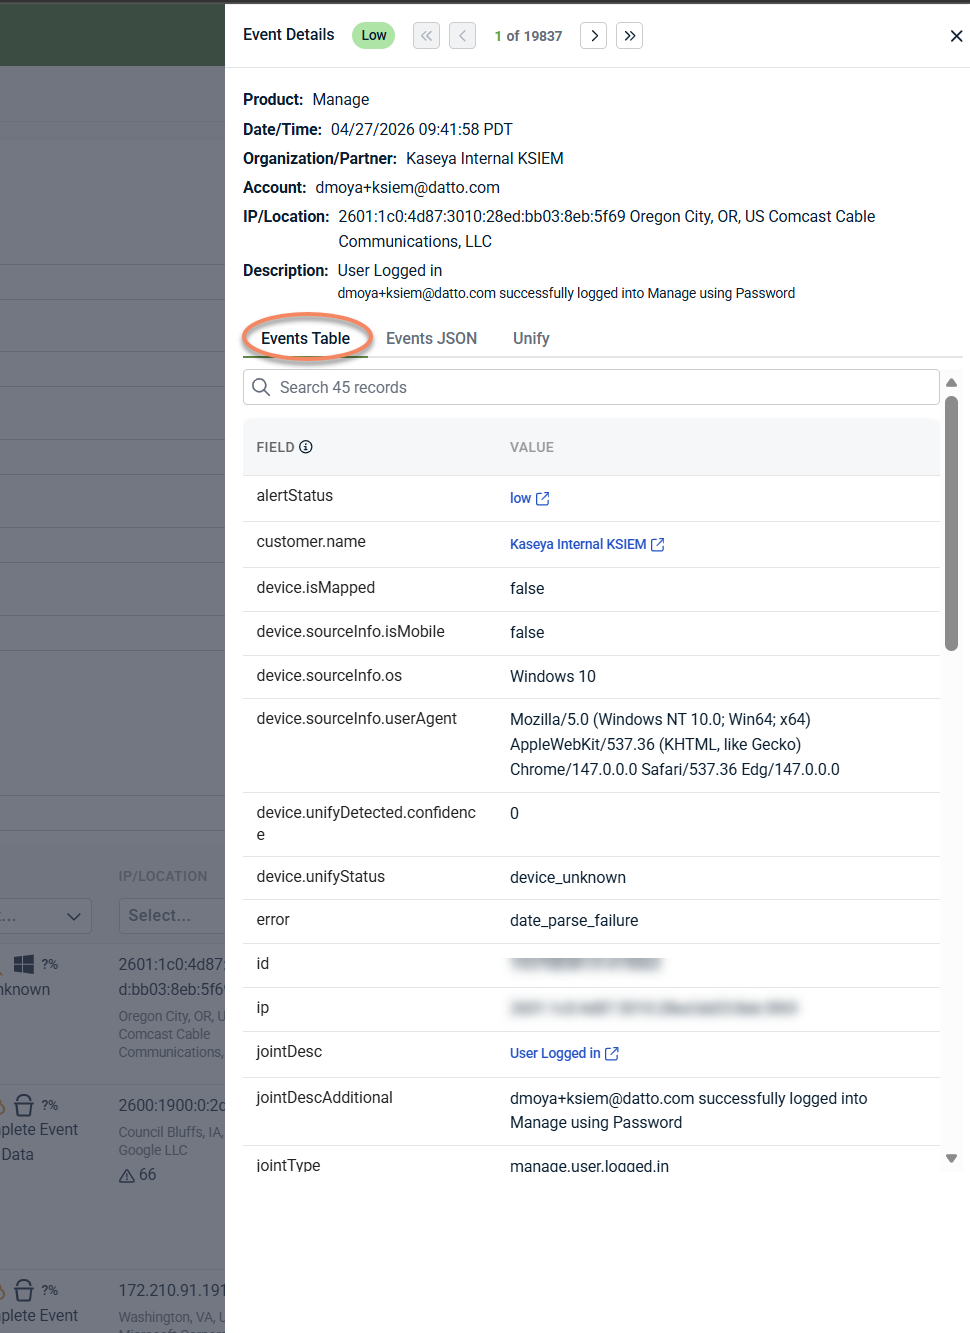
-
Events Table: The Events Table tab displays a normalized list of fields and values associated with the record. This view highlights key attributes such as device details, source information, and enrichment fields, making it easier to understand why the activity appears in Analysis.
-
Events JSON: The Events JSON tab displays the underlying structured data for the record in JSON format. This view is useful for advanced troubleshooting, exporting precise technical details, or sharing raw event context with other teams.
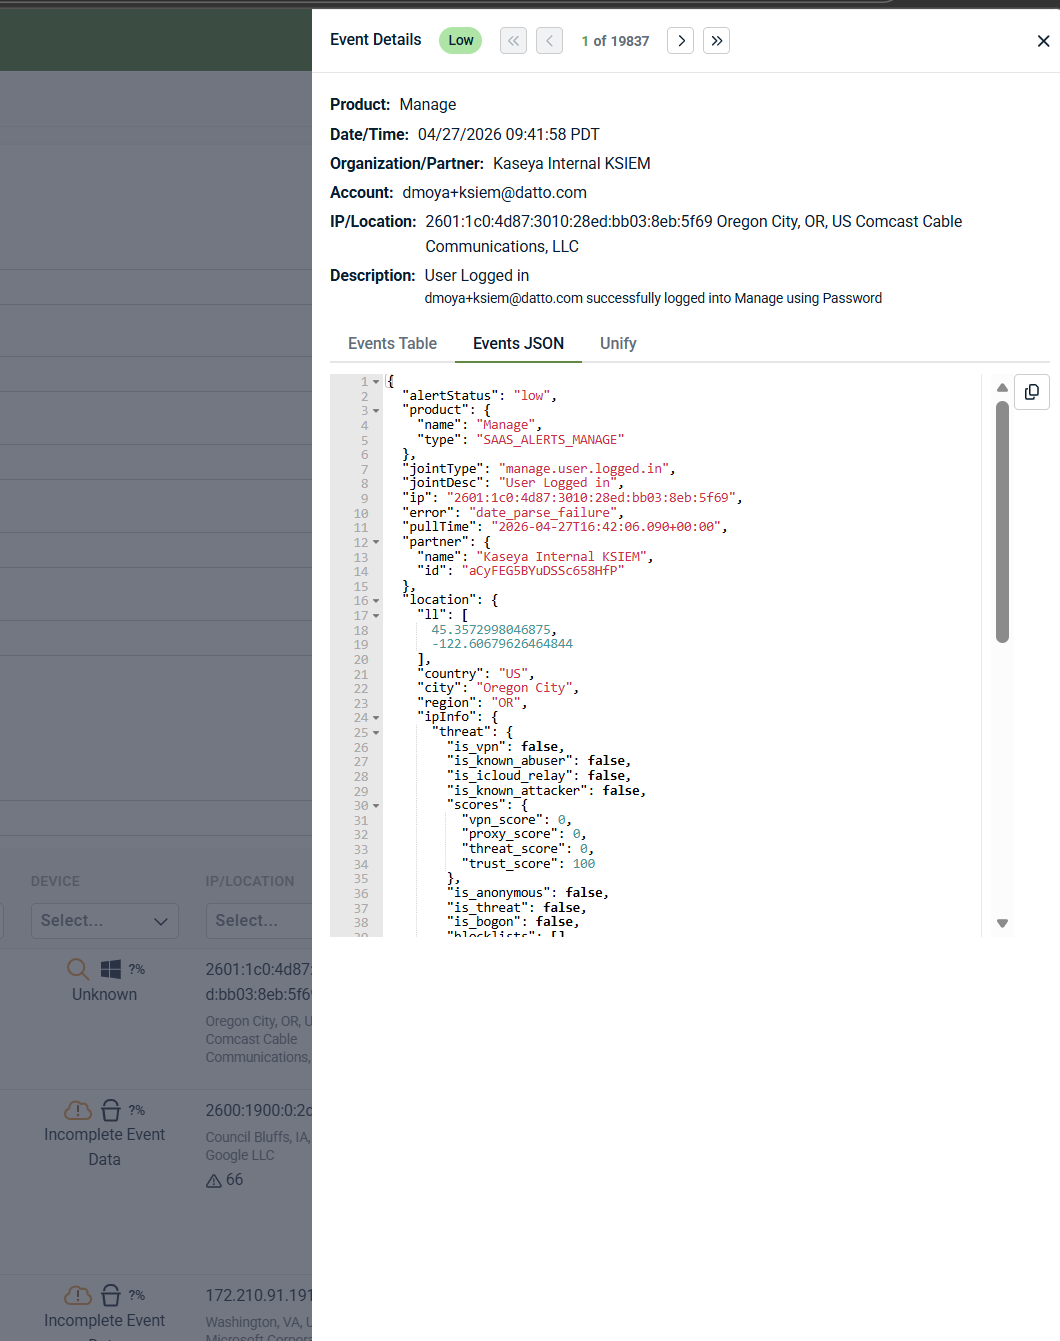
-
Unify: The Unify tab displays enrichment data provided by Unify, when available. This information helps reconcile device and identity data across products and environments. Availability depends on data source and Unify configuration.
When to use each tab (quick guide)
-
Events Table: Use for readable, normalized details and quick context during investigation.
-
Events JSON: Use when you need raw, structured data for advanced troubleshooting or to share precise technical context.
-
Unify: Use to review identity and device enrichment across products, when Unify data is available. See Configuring Unify for background on enrichment behavior and data dependencies.
You can move between records using the navigation controls at the top of the Event Details panel.
Each row in the results table may include action icons that provide additional context about the activity.
-
Recommendation (ℹ): Click the information (i) icon to view system‑generated guidance for the selected record. The recommendation panel explains whether any action is required and may indicate that the activity is informational and logged for forensic or historical purposes.
-
Suppression indicator: The bell-with-a-slash icon represents the suppress action. Clicking this icon initiates the alert suppression workflow, which should be used only after investigation confirms the activity is expected or low risk. For some records—such as system‑generated activity—suppression is not available. In those cases, the suppress action cannot be applied, even though the icon is displayed.

Even when suppression is unavailable, the activity remains logged and remains visible in Analysis for investigation and historical context. For detailed information, refer to Advanced alert suppression.
These indicators help you understand the context of the activity and whether any action is recommended during investigation.
How filters behave
Some filters apply additional rules that are helpful to understand:
-
IP Address(es): Enter multiple IPs separated by commas or Enter. Wildcards are supported (for example, 192.168.*).
-
Account(s)/User(s): User lookup occurs in real time. Enter at least three characters to trigger search results.
-
ASN(s): The ASN list is populated based on observed activity from the last 24 hours.
-
IP Threat Score >: Accepts values from 0 (lowest threat) to 100 (highest threat).
-
Country(ies): Based on IP geolocation, not user or device location.
-
PSA Ticket Status: Filters activity based on the PSA ticket lifecycle state.
-
Product(s): Filters results by the product or detection source that generated the activity.
-
Unify Status: Filters activity using Unify enrichment data, which may not be available for all records.
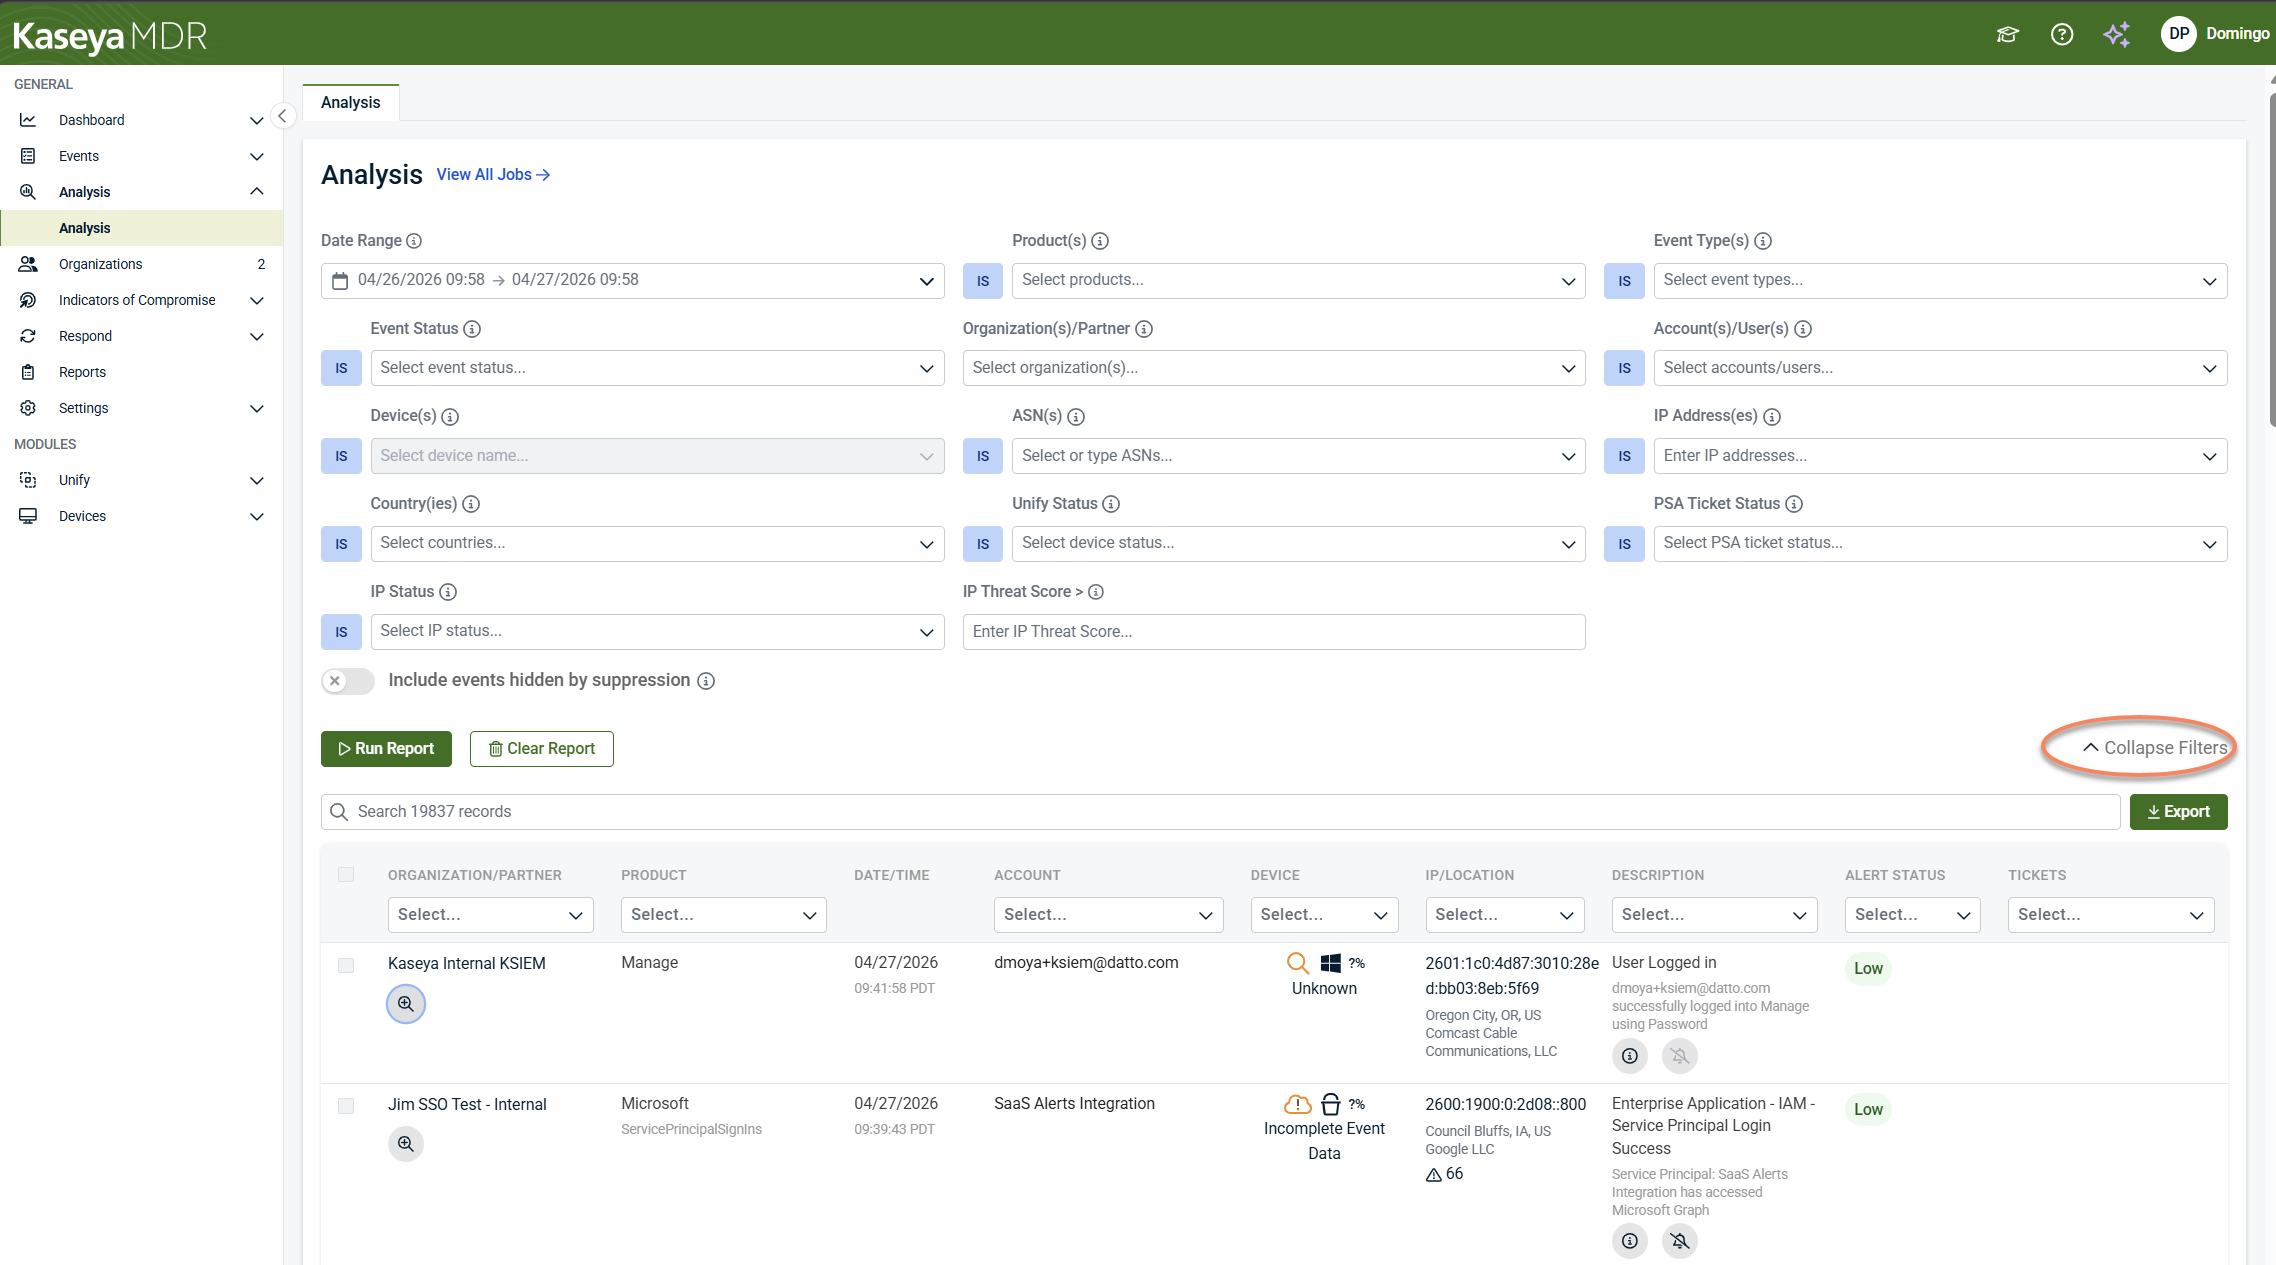
Clearing or resetting an investigation
-
Click Clear Report to reset filters and results
-
Use Collapse Filters to hide the filter panel and focus on results
Exporting investigation data
Click Export in the upper‑right corner of the results table to download investigation data for reporting or offline review.
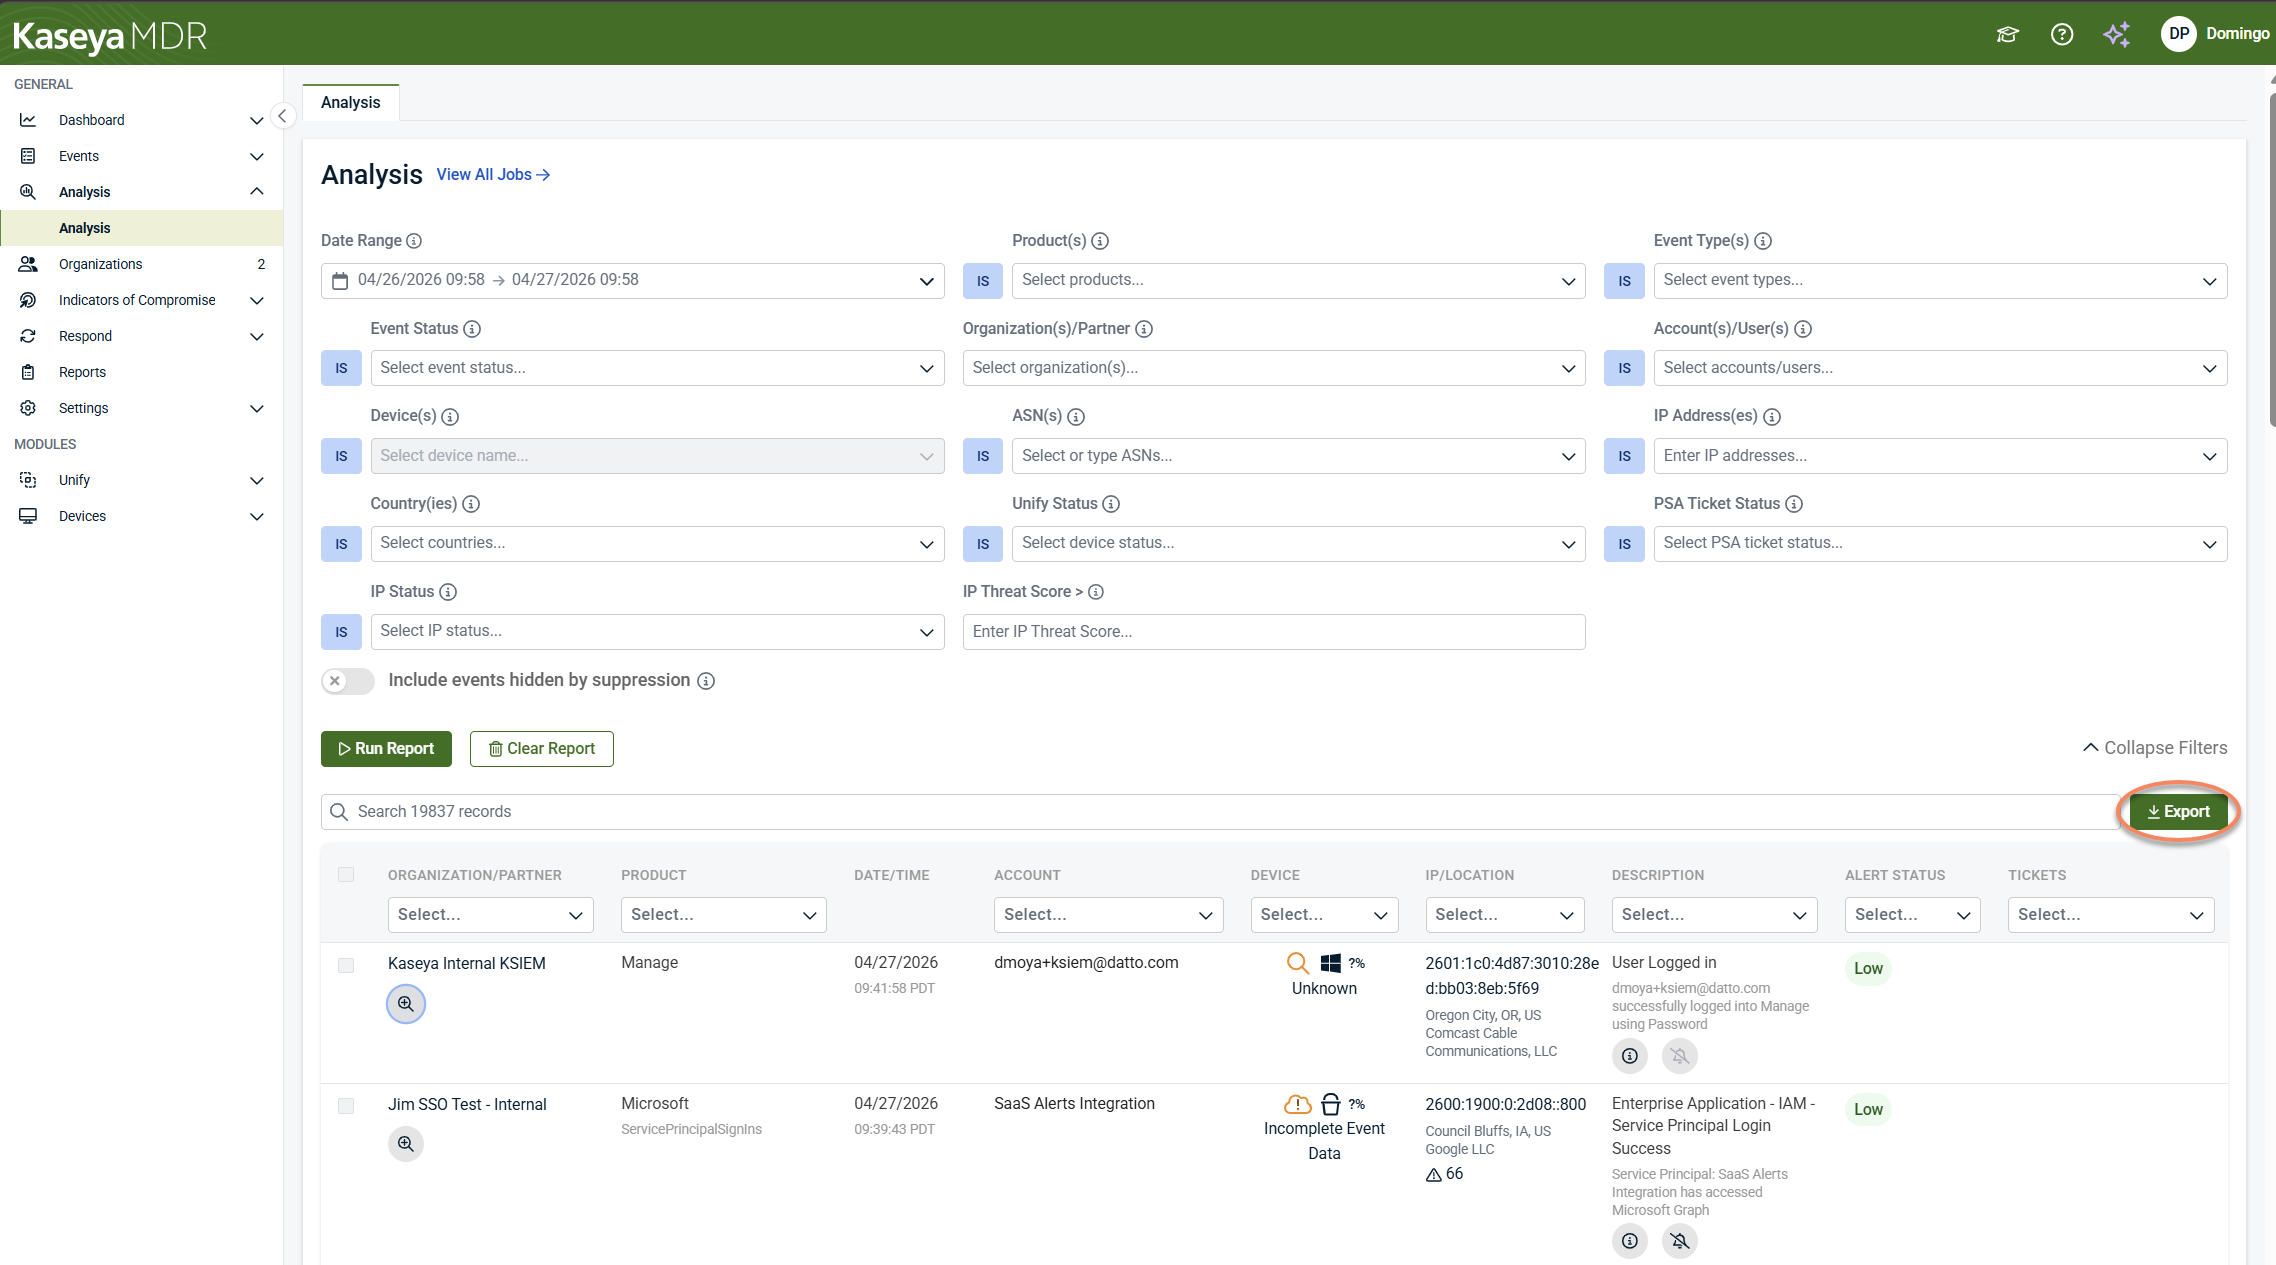
NOTE For security reasons, file paths are not included in exported data.
Using Analysis to manage alert noise
The Analysis page can also be used to understand alert volume and distinguish meaningful signal from background activity.
Reviewing alert volume before notifications or ticketing
-
From the side navigation menu, clickAnalysis.
- Select a 1–2 week date range.
- FilterEvent Status to Medium and Critical.
- Scope to all users or a specific organization.
- ClickRun Report.

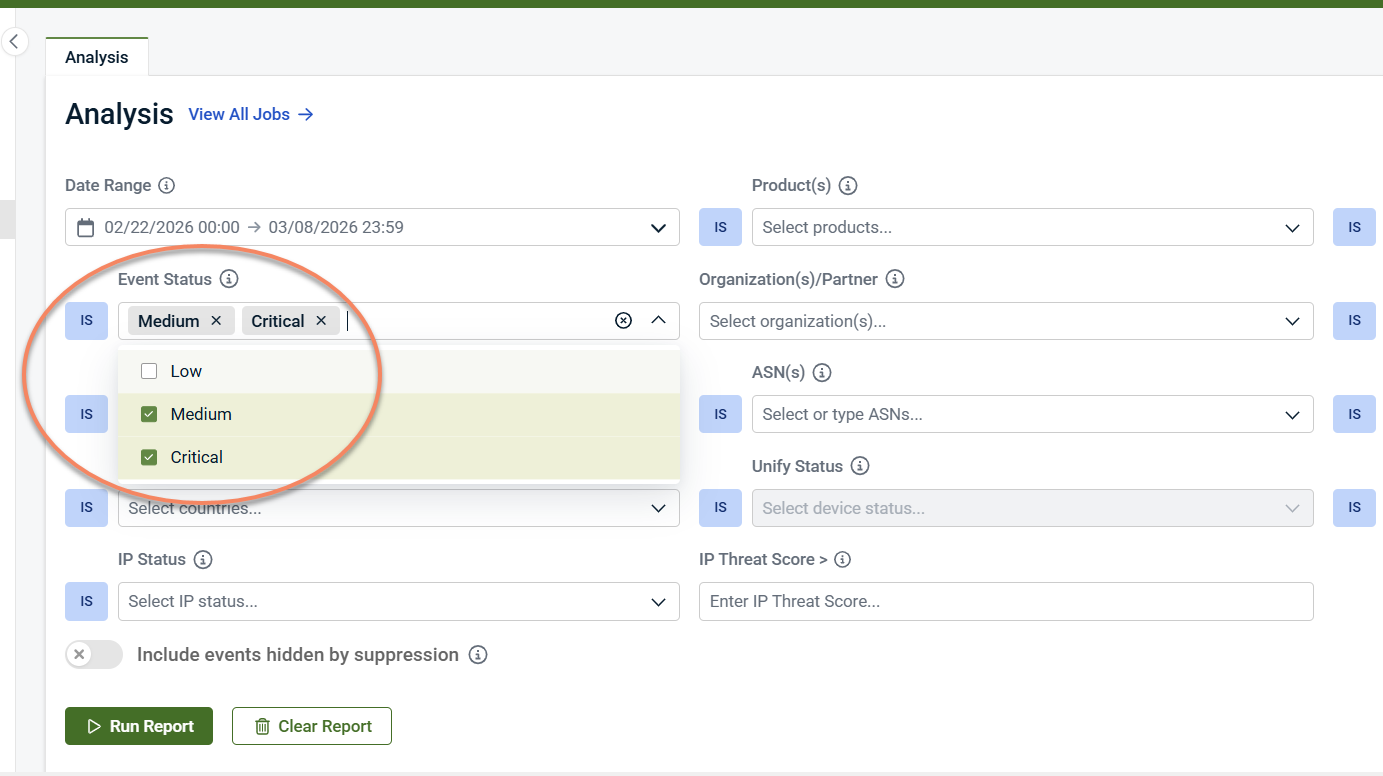
This shows which alerts would have generated notifications or PSA tickets if integrations were enabled.
Reviewing low‑severity activity
Low‑severity alerts do not generate notifications but remain searchable in Analysis. This allows you to reduce noise while preserving visibility.
Using results to guide tuning decisions
Look for activity that is:
-
High‑frequency
-
Informational
-
Expected in your environment
-
Not actionable on their own
These patterns often indicate candidates for severity tuning or suppression. After tuning, Analysis can be used again to confirm that noise has been reduced without losing visibility into important activity.
Relationship to the Dashboard and Response
-
Use the Dashboard for high‑level visibility and prioritization
-
Use the Analysis page for investigation and validation
-
Use investigation context to inform response actions and minimize false positives
The Analysis page bridges detection and response, ensuring actions are taken with full context.
Related articles
-
Exploring the dashboard: Explains how MDR alerts are prioritized on the Dashboard and when to use the Analysis page for deeper investigation
-
Working with alerts: Provides detail on alert severity, alert lifecycle, and how MDR alerts are investigated and validated using Analysis
-
Managing noise and signal: Describes how to reduce alert noise through tuning and suppression while keeping activity visible for investigation


