Application configurations
Application configurations define how individual detection and integration components behave within Kaseya MDR. They control application‑specific behavior such as ingestion, tuning, exclusions, and reporting presentation.
These settings are managed by administrators and can influence alerts, investigations, and response workflows across the platform. Only users with appropriate administrative permissions can modify them.
Application configurations affect how telemetry is evaluated and presented, but they do not define detection logic or execute response actions.
In Kaseya MDR, application configurations are managed from Settings > Application Configurations.
Common questions this article answers include:
-
What are application configurations in Kaseya MDR?
-
How do application configurations differ from detection logic or response behavior?
-
When should application configurations be adjusted versus left at default settings?
-
How do global defaults and organization overrides apply to application configurations?
-
Which application configuration areas affect visibility, tuning, or ingestion?
This article builds on the global default + organization override model described in Global defaults and organization overrides.
What application configurations do
Application configurations define baseline behavior for how specific applications ingest, evaluate, or present telemetry once it reaches Kaseya MDR.
They are used to:
-
Adjust how telemetry is evaluated or contextualized for a specific application
-
Apply exclusions or sensitivity adjustments where supported
-
Customize behavior for a specific organization using overrides
Application configurations do not:
-
Replace detection rules
-
Execute response actions
-
Modify SOC authorization or investigation workflows
When to configure application settings
Not all application configurations require immediate changes. Use the following guidance to determine when to adjust settings.
During onboarding
-
Configure ingestion‑related settings when introducing a new data source
-
Ensure required integrations are enabled and reporting data
After onboarding (tuning phase)
-
Adjust detection‑related settings after reviewing baseline alert behavior
-
Apply exclusions only when activity is well understood and expected
Ongoing
-
Review configurations periodically
-
Validate that exclusions and tuning changes remain appropriate over time
Because application configurations can impact visibility, changes should be made deliberately and documented internally.
Best practice: start with defaults
Application configurations are preconfigured to align with SOC‑managed detection and response workflows.
In most environments:
-
Use default settings during initial deployment
-
Make changes incrementally after observing live activity
Cross‑product considerations
Application configurations control behavior within Kaseya MDR, but they do not operate in isolation.
When Kaseya MDR is used alongside other Kaseya Platform products (such as Datto EDR or RMM), certain capabilities, such as ransomware detection or alert handling, may be managed in a different product based on your platform design.
Overlapping configuration of the same capability across multiple products can result in duplicate processing, increased resource usage, or inconsistent behavior.
For guidance on coordinating configurations across products, see
Application configurations at a glance
The table below summarizes the application-level configuration areas available under Settings > Application Configurations, what each area controls, and when it is typically configured across onboarding and tuning phases.
| Application | What it controls | When to configure | Common use case | Caution |
|---|---|---|---|---|
| Advanced Breach Detection | Detection tuning for activity mapped to MITRE ATT&CK tactics and techniques on the local device | During tuning, after baseline behavior is observed | Reducing noise from known processes or command‑line activity while maintaining visibility into advanced attack techniques | Exclusions reduce detection coverage |
| Datto Ransomware Detection | Ransomware‑ related detection behavior, including exclusions and reporting sensitivity | After initial onboarding, during environment‑specific tuning | Reducing noise from known processes while maintaining ransomware visibility | Exclusions reduce detection scope |
| Crypto Mining Detection | Detection behavior for known or suspected crypto‑mining activity | During tuning when legitimate workloads resemble mining behavior | Excluding approved domains or IPs | Over‑exclusion can hide malicious activity |
| Suspicious Tools | Exclusions for tools or utilities that may otherwise be flagged as suspicious | When approved tools generate alerts | Reducing alerts from known operational utilities | Path‑based exclusions reduce visibility |
| Suspicious Network Services | Evaluation of network service activity, including exclusions and custom service definitions | When legitimate services are flagged | Defining known services or excluding expected network behavior | Network‑level exclusions should be used sparingly |
| Firewall Log Analyzer | Ingestion, filtering, and forwarding of firewall and network device logs | During onboarding of firewall or network devices | Managing firewall syslog ingestion and filtering | Misconfiguration can impact log volume |
| Defender Manager | Microsoft Defender protection, scanning, threat handling, and exclusions | During endpoint security posture review | Aligning Defender behavior with organizational security policies | Changes directly affect endpoint protection |
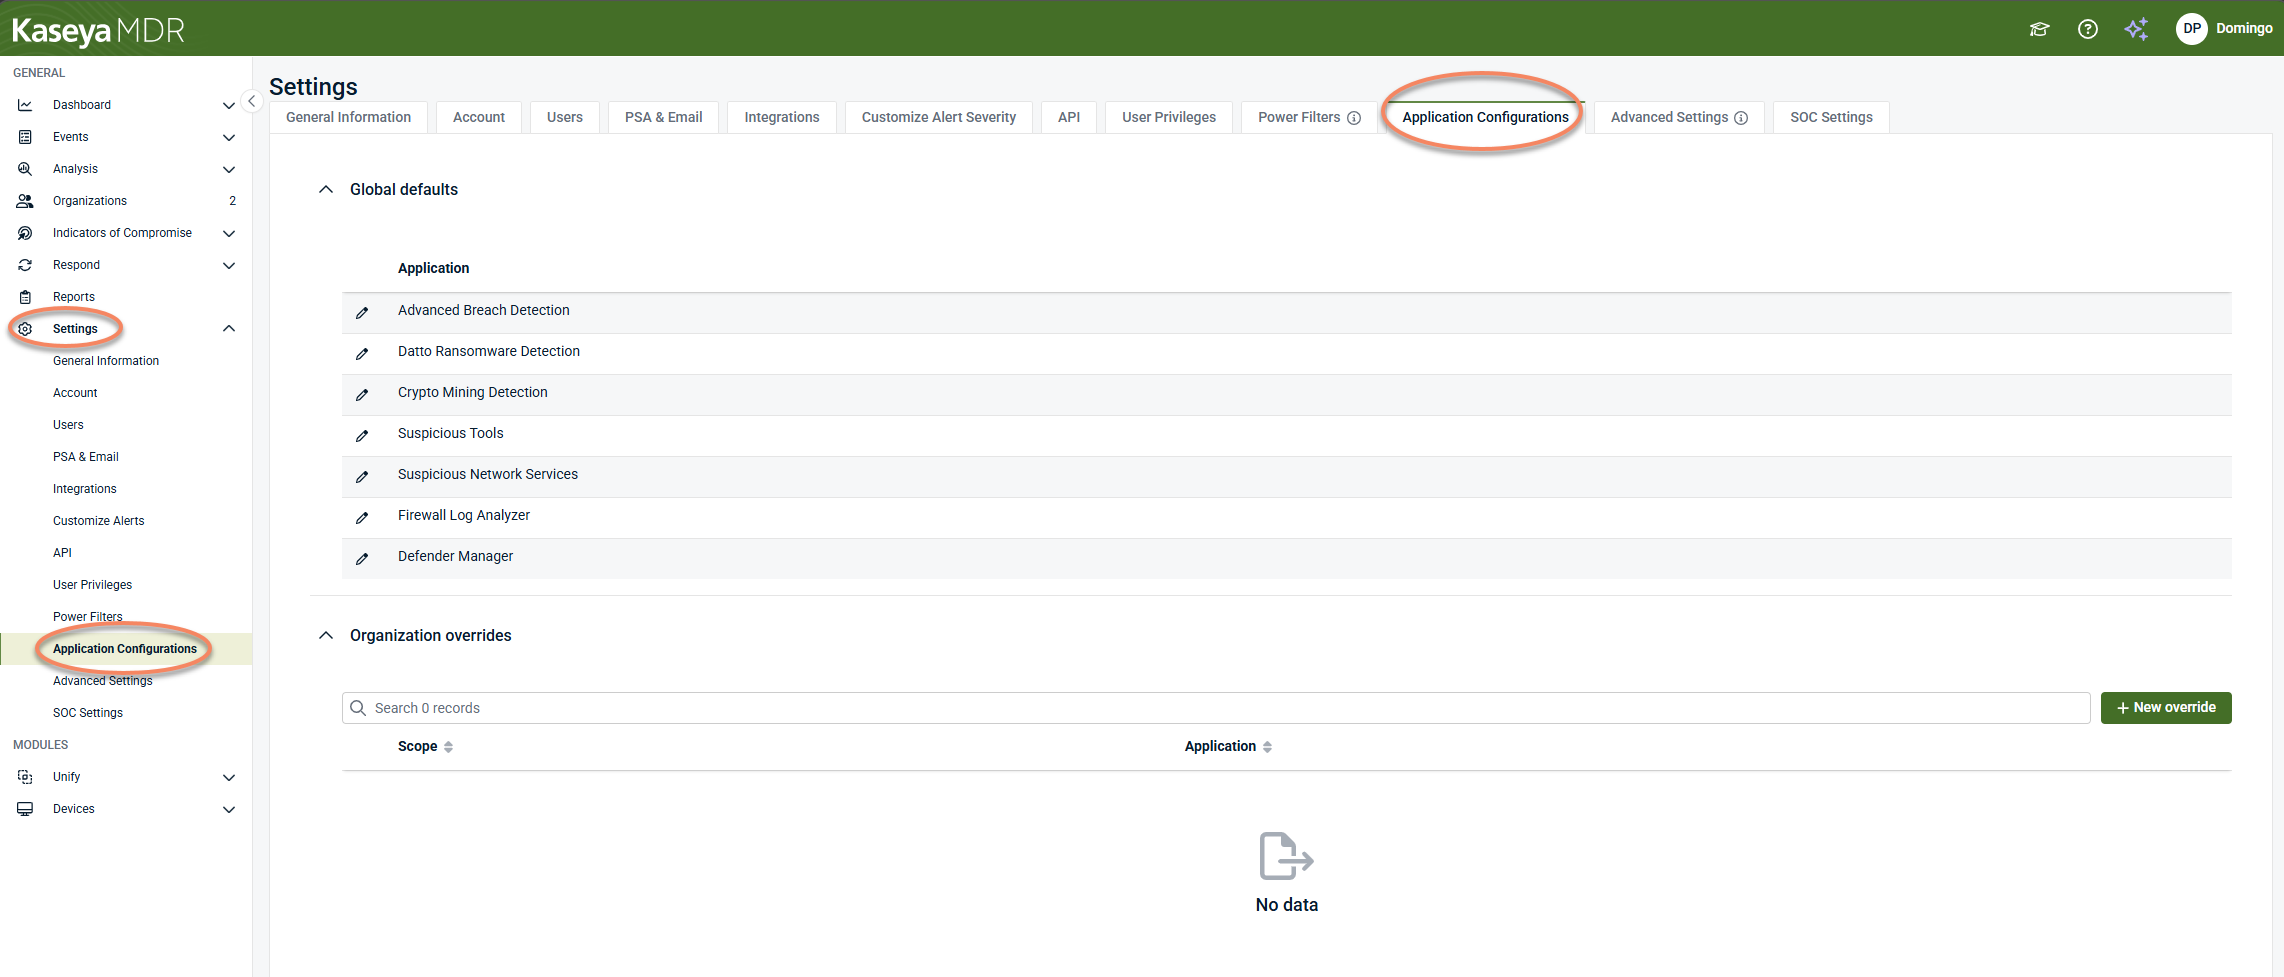
Accessing application configurations
Application configurations are managed from the Settings area.
To access application configurations, follow these steps:
-
From the side navigation menu, click Settings.
-
Select the Application Configurations tab.
The Application Configurations page is organized into two scopes:
-
Global defaults, which apply to all organizations unless an override exists
-
Organization overrides, which allow application behavior to be customized for a specific organization
Changes are applied when you select Save. If you leave the page without saving, your changes are not applied. Changes are applied at the current scope (global default or organization override).
Understanding global defaults and organization overrides
By default, application configurations are defined at the global level and apply to all organizations unless an override exists.
You can create organization overrides to customize application behavior for a specific organization. When an override exists:
-
The organization no longer inherits the global default for that application.
-
Application behavior is determined by the organization‑specific configuration.
For detailed information, see Global defaults and organization overrides.
Application‑specific configurations
Each application listed under Application Configurations exposes its own configuration options. Available settings vary by application and reflect the type of telemetry being ingested or evaluated.
Advanced Breach Detection is an agent‑based detection component that identifies activity mapped to MITRE ATT&CK tactics, techniques, and procedures (TTPs) on the local device.
It evaluates attacker techniques associated with system and network compromise, such as discovery, persistence, defense evasion, execution, credential access, privilege escalation, and lateral movement.
This application supports detection only. Investigation and response behavior are managed separately through SOC workflows.
Configuration options
The following options are available when you select Advanced Breach Detection:
-
Enabled CLI commands: Specifies command‑line patterns that are considered during detection analysis. These commands are evaluated as part of breach‑related detection logic.
-
Report low confidence results: Includes lower‑confidence detection results in reporting and alerting. Disabling this option may reduce noise but can also reduce visibility into early or ambiguous activity.
-
Excluded parent processes: Excludes specific parent processes from detection analysis. This option is commonly used to reduce false positives for trusted system processes or well‑understood administrative workflows.
-
Excluded registry values: Excludes specific registry values from detection evaluation when evaluating breach‑related behavior
IMPORTANT Exclusions reduce detection scope. Add exclusions only when the behavior is well understood and expected, and document the reason for each exclusion.
Datto Ransomware Detection is a response-oriented application configuration that controls how Kaseya MDR responds to ransomware activity on an endpoint. These settings can include actions such as device isolation or process termination and should be reviewed carefully due to their operational impact.
Important
When Kaseya MDR is used alongside other Kaseya Platform products (such as Datto EDR or RMM), ransomware detection should be managed in a single location.
Configuring ransomware detection in multiple products can result in duplicate processes on the endpoint, increased resource utilization, or conflicting behavior.
In environments that include Datto EDR, ransomware detection is typically managed through Datto EDR rather than Kaseya MDR.
For additional guidance, see Best practices for integrating with the Kaseya Platform.
For details on available settings and their effects, see Configuring Datto Ransomware Detection.
The Crypto Mining Detection configuration controls how known or suspected crypto‑mining activity is identified.
Configuration options
The following options are available when you select Crypto Mining Detection:
-
Enabled miner domains: Defines domains associated with known mining activity that should be monitored
-
Excluded miner domains: Specifies domains that should be excluded from mining detection
-
Excluded IP addresses: Specifies IP addresses that should be excluded from mining detection
These options are commonly used to tune detection behavior in environments where legitimate activity may resemble mining patterns.
The Suspicious Tools configuration allows administrators to define exclusions for tools or utilities that may otherwise be flagged as suspicious.
Configuration options
The following options are available when you select Suspicious Tools:
-
Excluded paths: Specifies file system paths that should be excluded from suspicious‑tool detection.
This configuration is typically used to reduce false positives for legitimate administrative or operational tools.
The Suspicious Network Services configuration controls how Kaseya MDR evaluates network service activity. It allows administrators to define exclusions or custom network definitions to account for expected or known behavior.
This configuration is typically used to reduce false positives related to legitimate internal services or known network patterns.
Excluded networks tab
Use the Excluded networks tab to define network‑level exclusions.
-
Excluded IP addresses: Specifies IP addresses that should be excluded from suspicious network service detection. Commonly used to exclude known internal systems, trusted infrastructure, or expected service endpoints
-
Excluded parent processes: Specifies parent processes whose network activity should be excluded from detection. Typically used when known applications or services legitimately open network connections that would otherwise appear suspicious
IMPORTANT Exclusions reduce detection coverage. Add exclusions only when the activity is well understood and expected.
Custom networks tab
Use the Custom networks tab to define specific network services that should be treated as expected or known.
Custom networks are defined by protocol, port, and traffic direction, allowing Kaseya MDR to recognize legitimate services in your environment.
Adding a custom network
To define a custom network service:
-
Select + New network.
-
Configure the following fields:
-
Port: The network port used by the service
-
Protocol: The network protocol (for example, TCP or UDP)
-
Traffic direction: Specifies whether the traffic is Inbound, Outbound, or Both
-
Service Name: A short name to identify the service (up to 100 characters)
-
Description: An optional description providing additional context (up to 255 characters)
-
-
Select Add network.
Custom networks appear in the list once added and can be reviewed or removed as needed.
Best practices
-
Start with default settings and observe alert behavior before adding exclusions.
-
Use Excluded IP addresses and Excluded parent processes sparingly.
-
Prefer custom networks when you want to explicitly document and allow known services.
-
Document why each exclusion or custom network was added.
-
Review configurations periodically as network architecture changes.
The Firewall Log Analyzer configuration controls how firewall and network device logs are ingested, stored, filtered, and forwarded into Kaseya MDR using syslog. For detailed configuration steps and options, see Configuring Firewall log ingestion.
The Defender Manager configuration controls Microsoft Defender protection, scanning, threat handling, and exclusions applied to managed endpoints.
Because these settings directly affect endpoint security posture, they should be configured carefully.
For detailed configuration options and best practices, see Defender Manager.
Best practices
-
Start with global defaults and adjust only when necessary
-
Make changes incrementally and review their impact before making additional adjustments
-
Use organization overrides only when an organization requires behavior different from the global standard
-
Document why exclusions or advanced settings are configured
-
Review application configurations periodically, especially after onboarding new organizations or data sources
Related articles
-
Global defaults and organization overrides: Explains how global defaults and organization overrides determine which application configurations apply across organizations
-
Power Filters and allowlisting logic: Describes how to manage surfaced visibility and investigation focus without changing application behavior, detection logic, or data ingestion
-
Advanced agent settings and organization overrides: Covers how agent‑level behavior (resource usage, logging, and diagnostics) is managed separately from using the same global default and override model
-
Configuring SOC settings: Explains how SOC communication preferences, authorization boundaries, and organization‑specific context are defined, and how they differ from application configurations


