Configuring Firewall Log Analyzer (Firewall log ingestion)
This article explains how to configure firewall log ingestion in Kaseya MDR.
Firewall log ingestion is configured at the organization level through Application Configurations. This configuration determines how firewall and network‑device logs are ingested and which existing agent is selected to receive and process those logs.
This article explains where to configure firewall log ingestion in the interface, how organization‑level overrides apply, and how firewall vendors fit into the ingestion model. It does not include vendor‑specific firewall configuration steps.
How firewall log ingestion works
In Kaseya MDR, firewall log ingestion is:
-
Configured in Settings > Application Configurations, using organization‑level overrides (not global defaults)
-
Based on selecting an already deployed agent to act as the log‑receiving device
For firewall and network‑device logs, Firewall Log Analyzer is the only supported ingestion path in Kaseya MDR. Firewall devices act as external syslog senders, while Kaseya MDR defines the log‑receiving endpoint through an existing agent.
Firewall devices themselves are not deployed or configured from the MDR interface. Instead, an existing agent is selected and configured to receive firewall telemetry sent via syslog. Firewall devices are configured separately—using their own vendor‑specific tools—to forward logs to that agent.
Firewall Log Analyzer documents how Kaseya MDR ingests firewall and network‑device syslog data. Configuration of firewall products remains vendor‑owned by design, which is why firewall logging is documented through a single, vendor‑agnostic workflow.
Step 1: Open Application Configurations
Firewall log ingestion is configured from Settings > Application Configurations, within the context of a specific organization.
Administrators use organization‑level overrides to:
-
Enable firewall log ingestion for an organization
-
Define how firewall log data is ingested and handled
-
Select a device (an already deployed agent) that will receive firewall syslog telemetry
Firewall log ingestion cannot be configured at a global level. It must be applied as an organization‑specific override.
Steps
-
From the side navigation menu, click Settings.
-
Select Application Configurations.
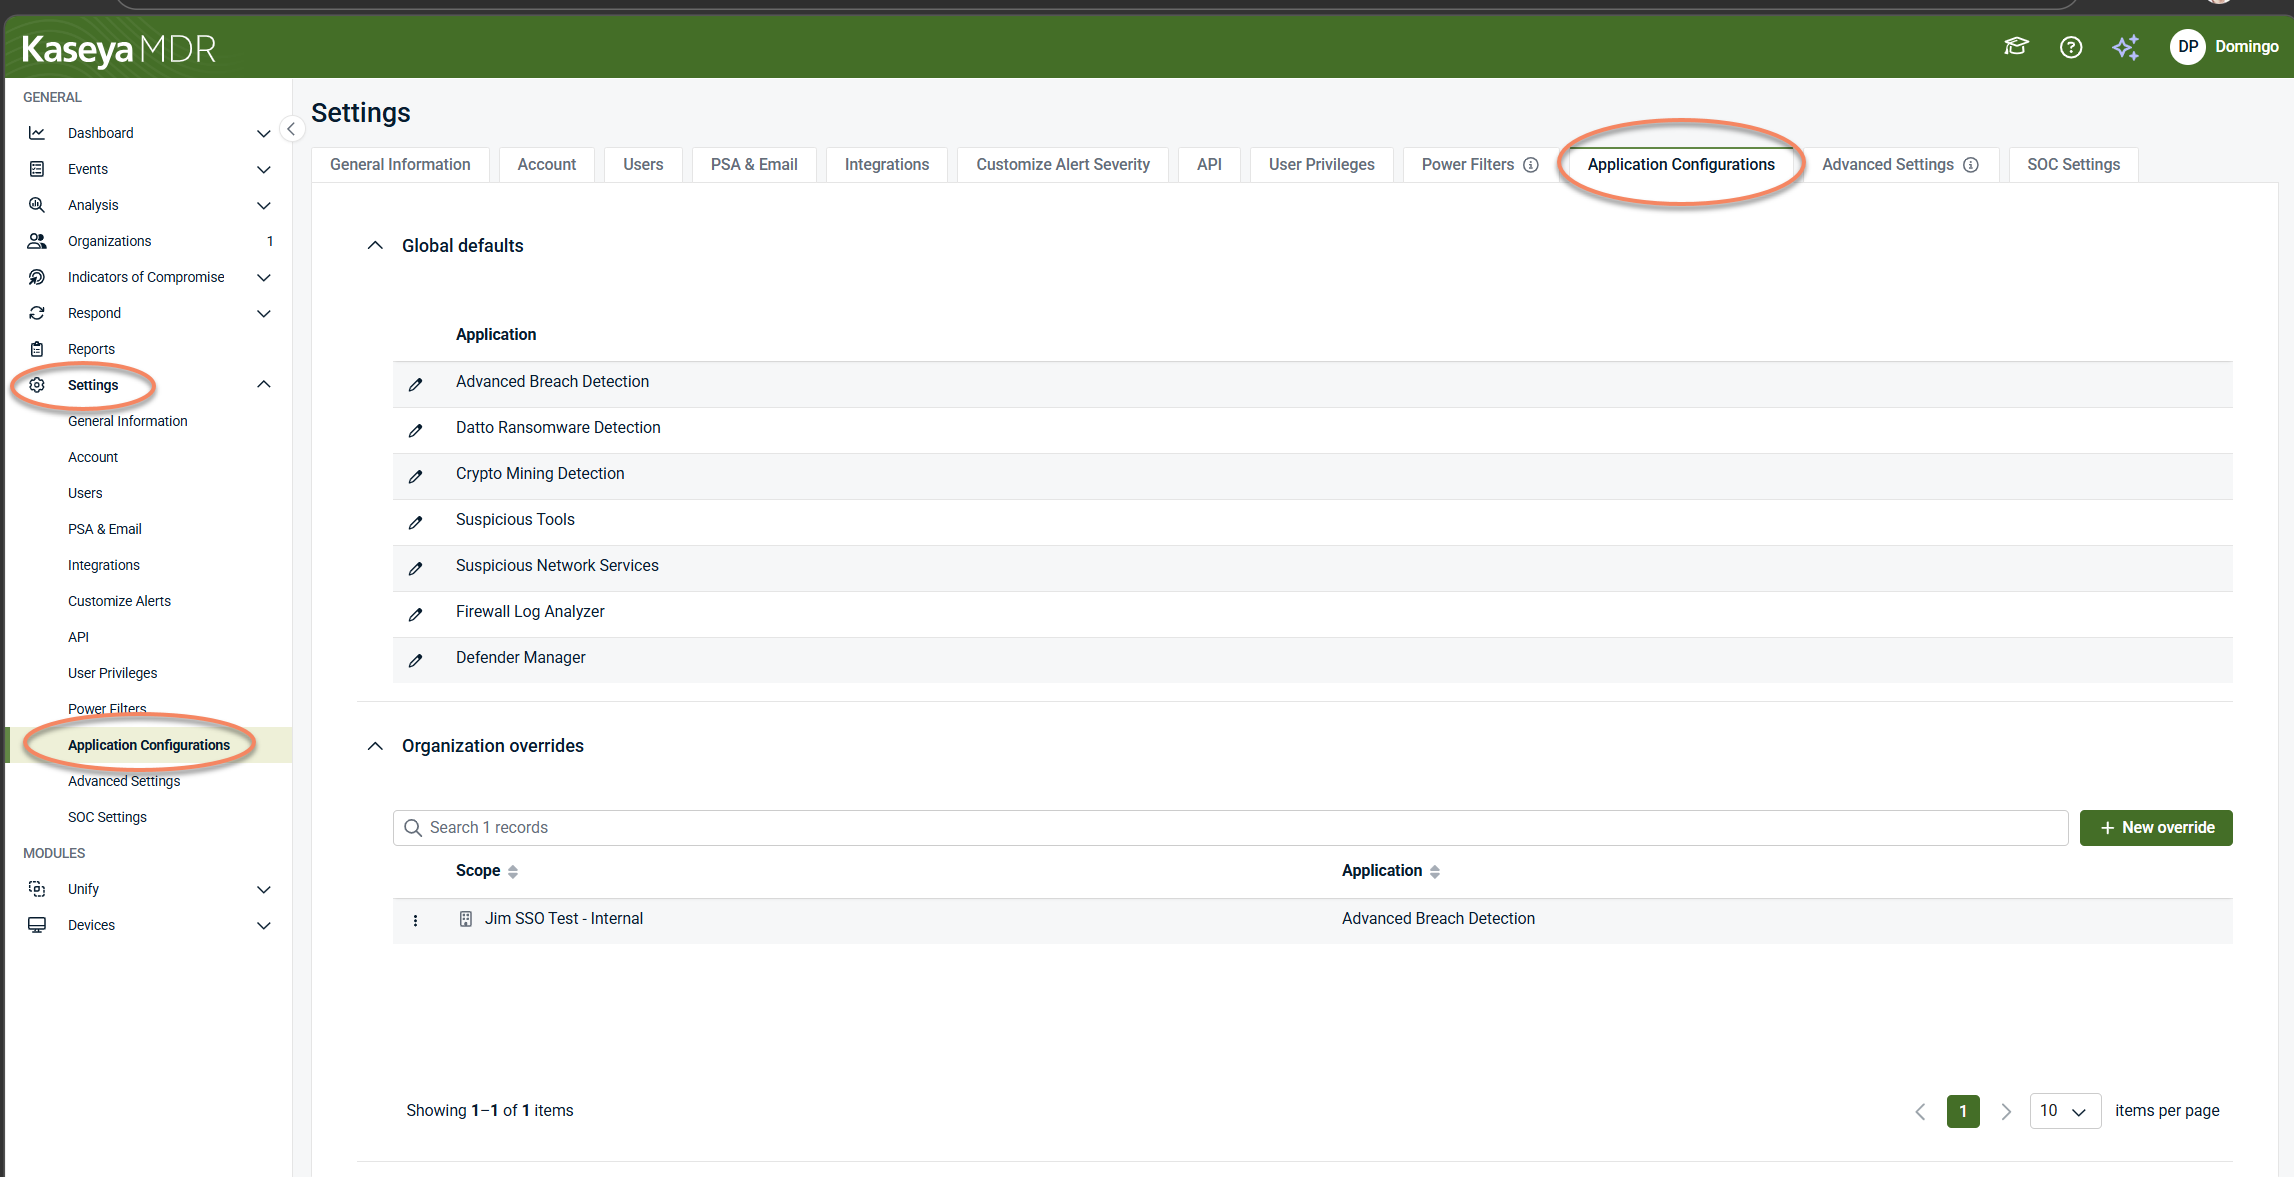
This page lists all applications that support organization‑level configuration, such as:
-
Advanced Breach Detection
-
Datto Ransomware Detection
-
Crypto Mining Detection
-
Suspicious Tools
-
Suspicious Network Services
-
Firewall Log Analyzer
-
Defender Manager
Each application is configured independently, depending on the type of telemetry or behavior being managed. Firewall log ingestion is configured only through the Firewall Log Analyzer application. For details on how application configurations and organization overrides work, see Application configurations.
Step 2: Select the organization and application
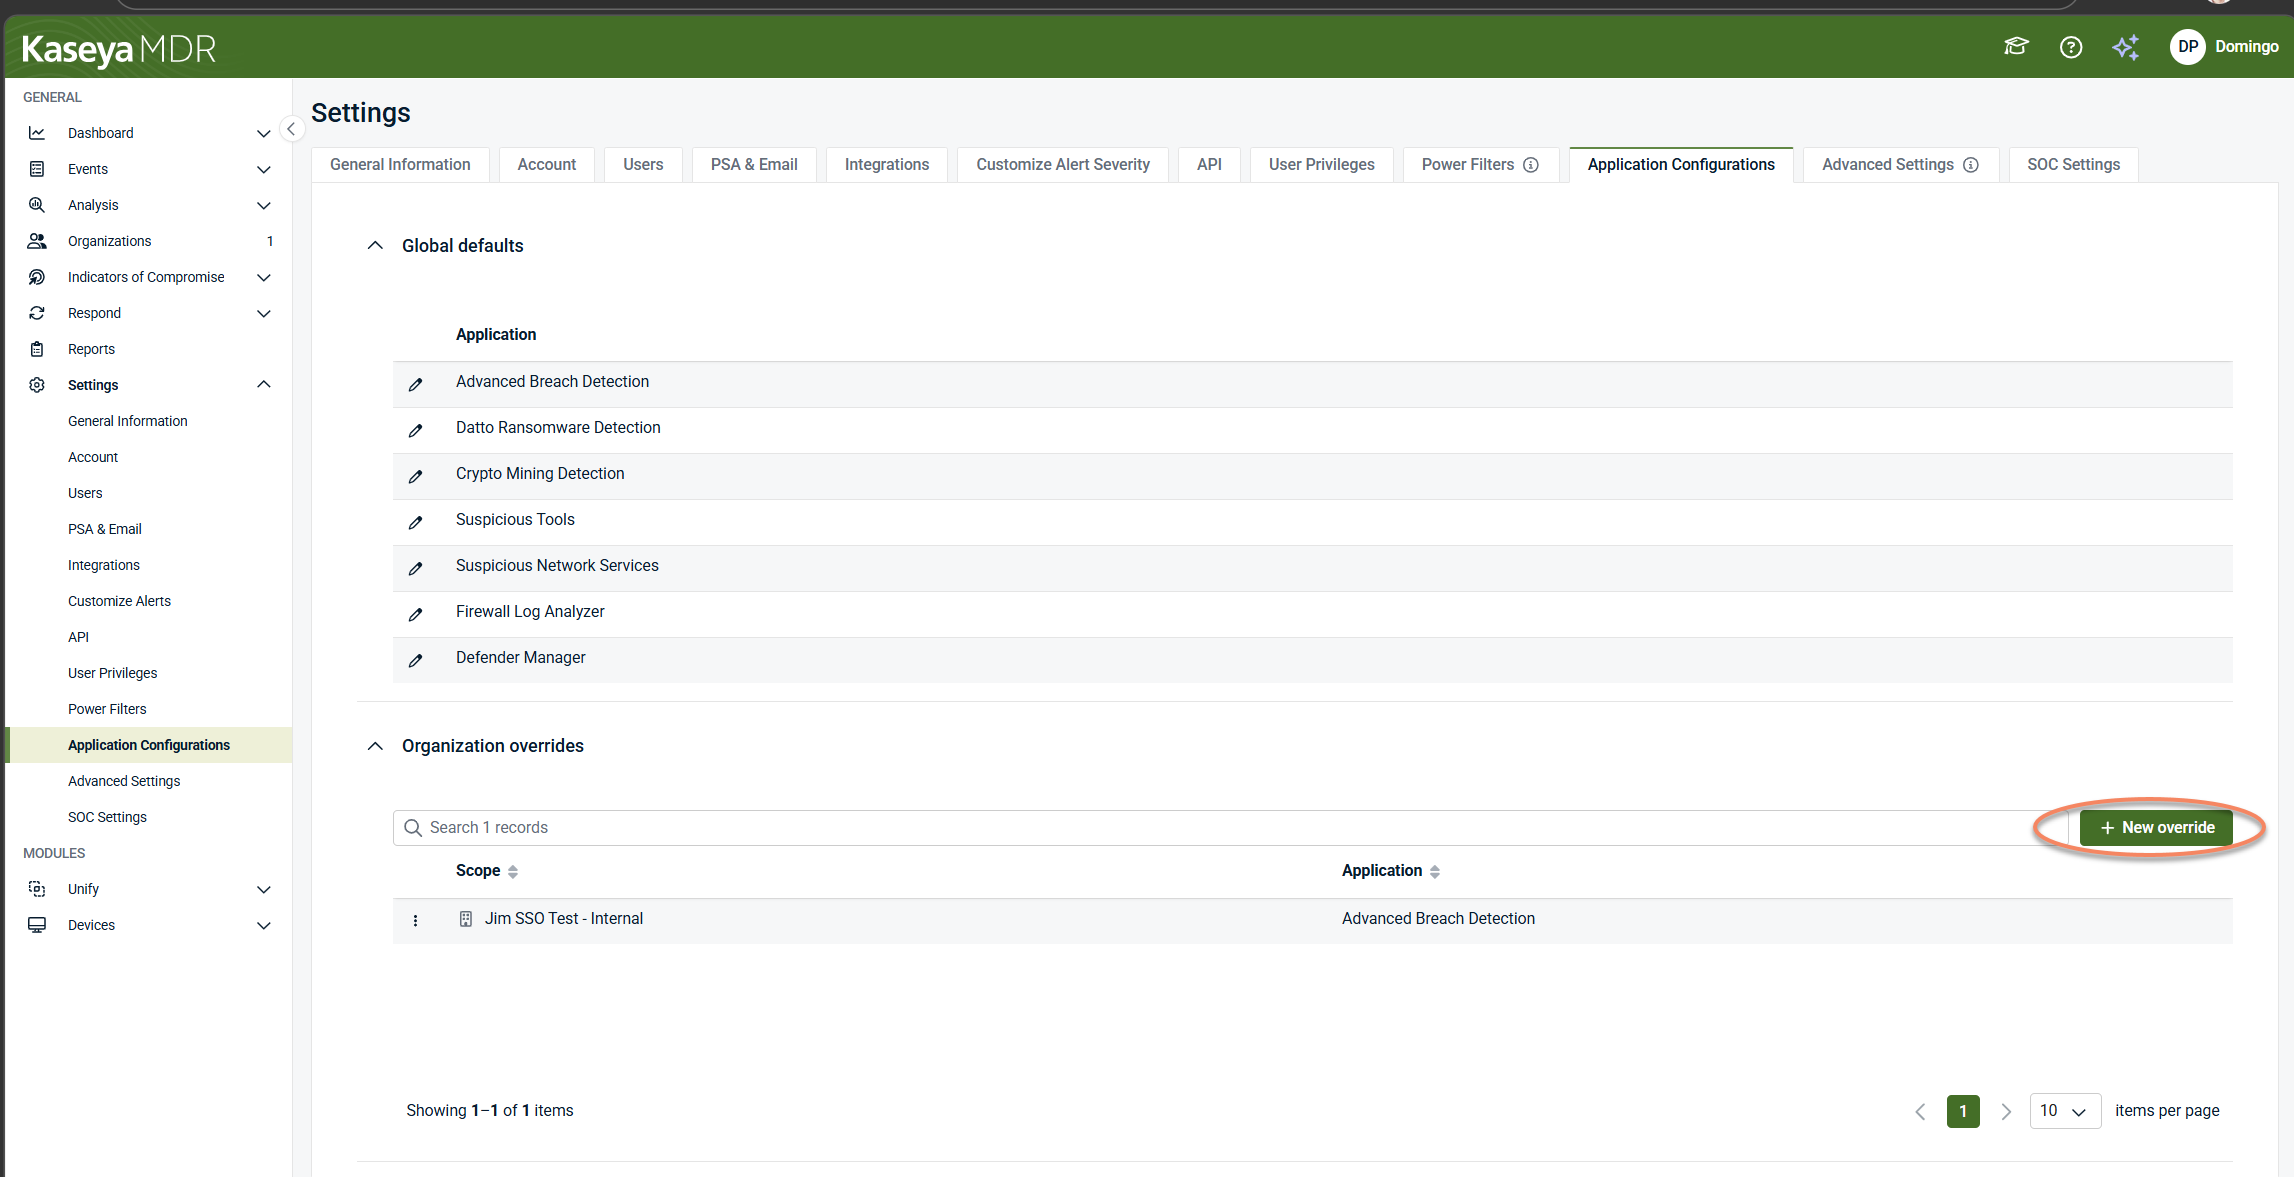
To configure firewall log ingestion, you must create or open an organization‑specific override.
-
Click + New override, or select an existing organization override.
-
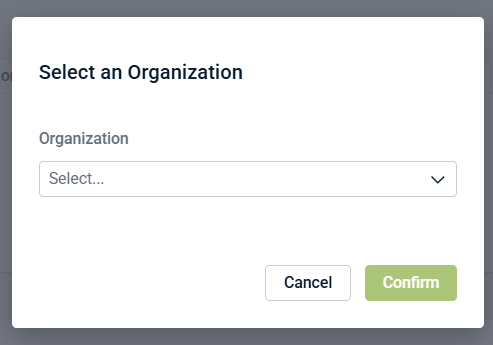
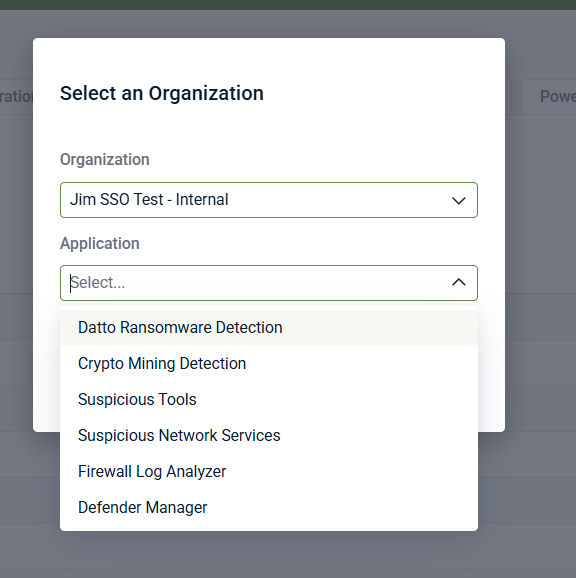
In Select an Organization, choose the target organization.
-
In Application, select Firewall Log Analyzer.
-
Click Confirm.
This opens an organization‑scoped configuration for firewall log ingestion. Firewall log ingestion is always configured in the context of a specific organization and cannot be applied globally.
IMPORTANT Select Firewall Log Analyzer only when configuring firewall log ingestion. Other applications in this list are used to configure different detection or analysis capabilities and do not ingest firewall logs.
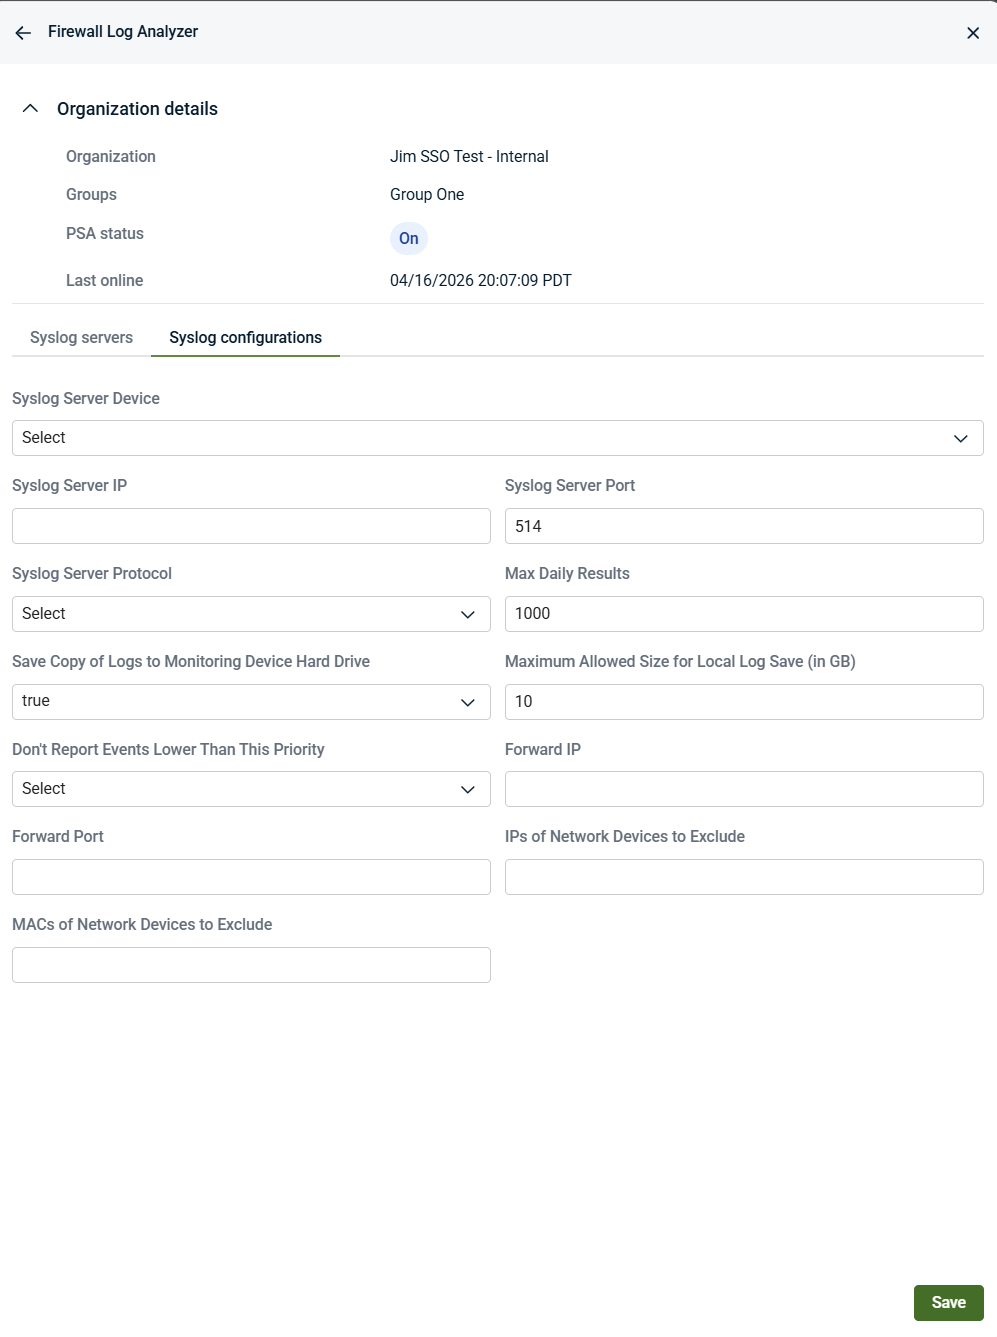
Step 3: Review organization details
At the top of the Firewall Log Analyzer screen, the Organization details panel provides context for the override you are editing, including:
-
Organization name
-
Group assignment
-
PSA status
-
Last online timestamp
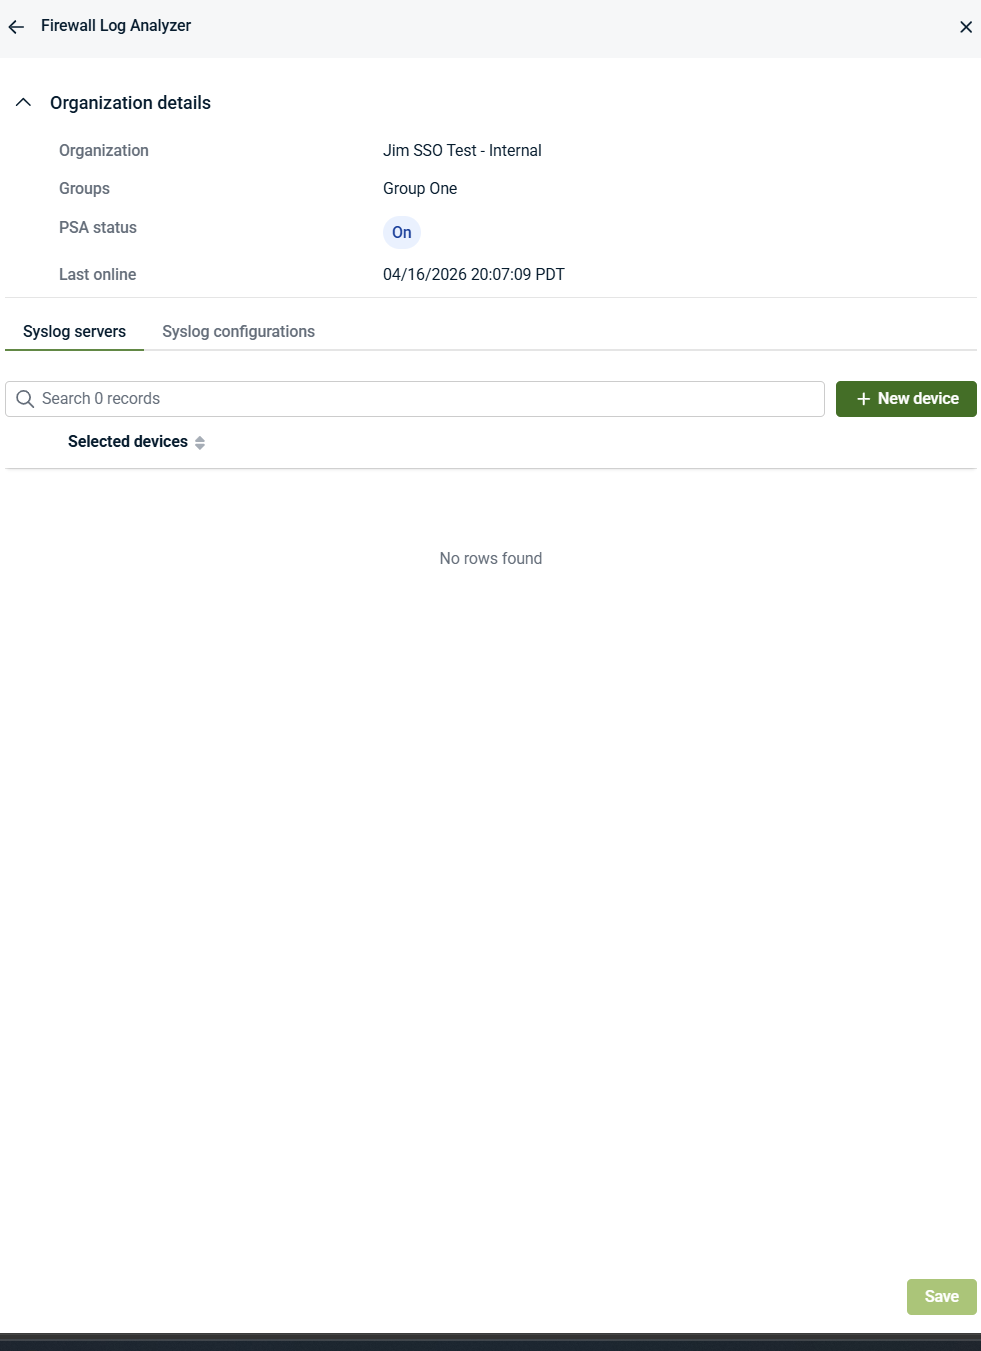
Use this information to confirm that you are configuring firewall log ingestion for the intended organization. Firewall log ingestion settings apply only within the organization selected for the override.
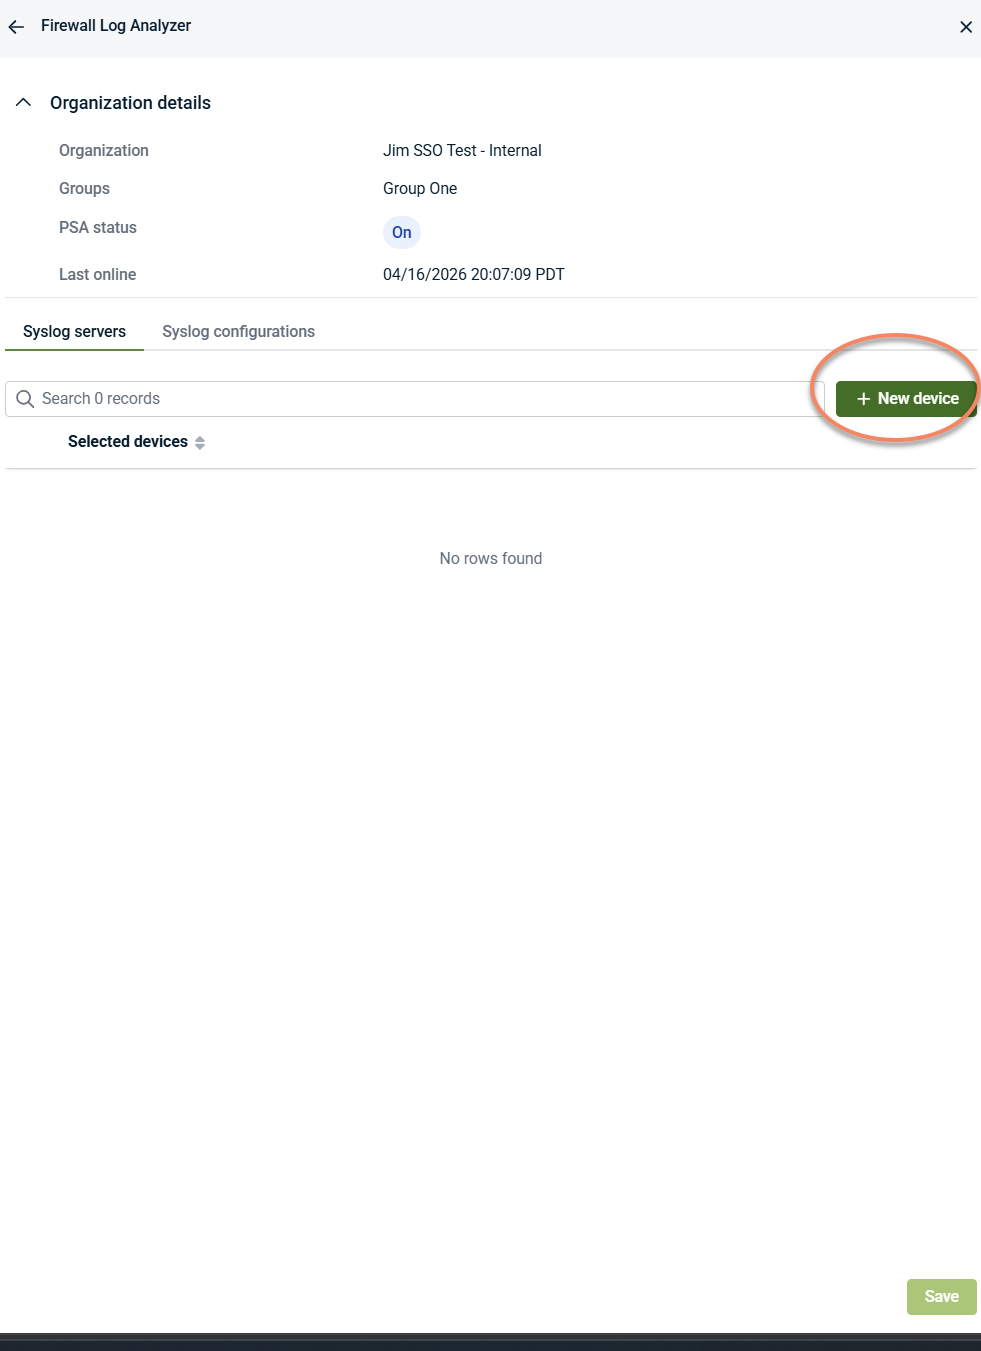
Step 4: Select the syslog server device
Firewall log ingestion requires selecting a device that will act as the log‑receiving endpoint.
-
Open the Syslog servers tab.
-
Click + New device.
-
Select a device from the list.
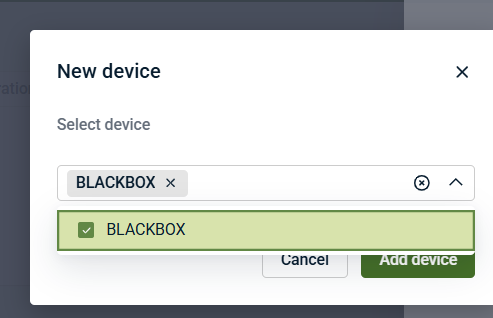
-
Click Add device.
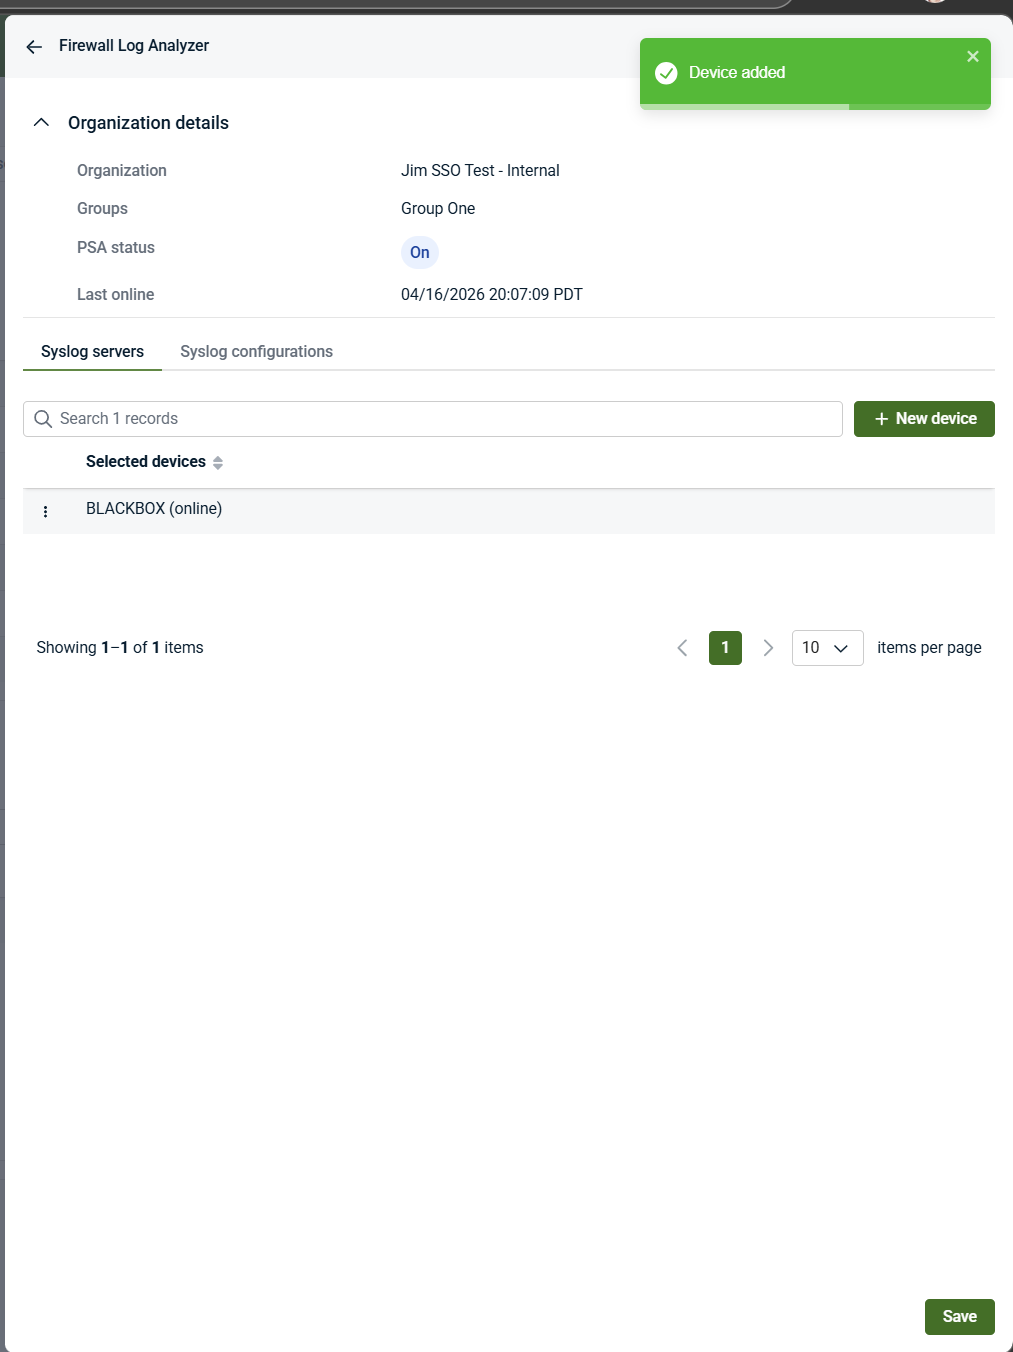
The selected device becomes the syslog server device. This device must already have an agent deployed and will be configured to receive and process firewall syslog telemetry sent from external firewall devices.
After the device is added, a confirmation message appears in the upper‑right corner.
Important notes about the syslog server device
-
The selected item is a device as shown in the UI, but it must already have an agent installed.
-
Devices are selected from existing deployed endpoints.
-
Firewall devices themselves do not appear as selectable devices.
-
This device acts only as a log‑receiving and log‑processing endpoint; it is not the firewall itself.
Step 5: Configure syslog settings
The Syslog configurations tab defines how firewall syslog data is received and handled after it arrives at the selected log‑receiving device.
-
Open the Syslog configurations tab.
-
Configure the required syslog settings, such as:
-
Syslog server IP
-
Syslog server port (for example, 514)
-
Syslog protocol
-
Log storage and retention options
-
Event filtering or exclusion options, if applicable
These settings control ingestion behavior only. They do not configure firewall devices and do not define vendor‑specific firewall logging rules.
Syslog configuration fields
The Syslog configurations tab controls how firewall logs are received, filtered, and stored after they arrive at Kaseya MDR through the selected log‑receiving device.
These settings control ingestion behavior only. They do not configure firewall devices themselves or define vendor‑specific logging rules.
-
Syslog Server Device: Identifies the selected device that acts as the log‑receiving endpoint. The device must already have an agent installed. This device receives and processes firewall syslog telemetry sent from external firewall devices. Firewall devices themselves do not appear here.
-
Syslog Server IP: Specifies the IP address used for syslog ingestion. This IP represents the network endpoint to which firewall devices send syslog data. It must be reachable from the firewall devices.
-
Syslog Server Port: Specifies the IP address used for syslog ingestion. This IP represents the network endpoint to which firewall devices send syslog data. It must be reachable from the firewall devices.
-
Syslog Server Protocol: Specifies the protocol used for syslog communication. This setting must align with the protocol configured on the firewall device.
-
Max Daily Results: Specifies the maximum number of syslog events processed per day. This setting limits ingestion volume and helps manage processing capacity.
-
Save Copy of Logs to Monitoring Device Hard Drive: Controls whether a temporary local copy of received syslog data is stored on the selected device. This can be useful for troubleshooting or local review.
-
Maximum Allowed Size for Local Log Save (in GB): Specifies the maximum disk space allocated for locally stored syslog data when local log storage is enabled.
-
Don’t Report Events Lower Than This Priority: Specifies the minimum priority threshold for syslog events. Events below the selected priority are not reported, helping reduce ingestion of low‑value or noisy data.
-
Forward IP / Forward Port: Specifies an optional destination for forwarding received syslog data. These settings control log forwarding behavior only and do not affect firewall configuration.
-
IPs of Network Devices to Exclude: Specifies IP addresses whose syslog events should be excluded from ingestion.
-
MACs of Network Devices to Exclude: Specifies MAC addresses of network devices whose syslog events should be excluded. Useful in environments with dynamic or reused IP addresses.
Important notes about these settings
-
These settings control how Kaseya MDR receives and processes firewall logs after they reach the selected log‑receiving device.
-
Firewall devices must be configured separately—using vendor‑specific management tools—to forward syslog telemetry.
-
Changes to these settings affect ingestion behavior only and do not modify SOC‑managed detection logic or response behavior.
-
These settings control how Kaseya MDR receives and processes logs, not how firewall devices are configured.
-
Firewall devices must still be configured separately—using vendor‑specific tools—to forward logs via syslog.
-
Changes to these fields affect ingestion behavior only and do not modify SOC‑managed detection logic.
-
These settings define how firewall logs are received, filtered, and handled once they reach the selected device.
Step 6: Configure the firewall to send syslog telemetry
After completing the syslog configuration in Firewall Log Analyzer, configure each firewall device to forward syslog events using the values displayed in the Syslog configurations tab.
On the firewall platform (for example, Cisco, Fortinet, Palo Alto), configure the following:
-
Set the syslog destination IP address to the Syslog Server IP shown in Firewall Log Analyzer.
-
Set the syslog destination port to the Syslog Server Port shown in Firewall Log Analyzer.
-
Set the syslog protocol to match the Syslog Server Protocol selected in Firewall Log Analyzer
This configuration is performed on the firewall itself, using vendor‑specific management tools. Kaseya MDR does not deploy, configure, or manage firewall devices.
As long as the firewall platform is supported and is configured to send syslog telemetry using the specified IP, port, and protocol, Kaseya MDR will ingest the firewall log data through the selected log‑receiving device.
Firewall devices do not appear as applications or devices in the MDR interface and are never configured from within Kaseya MDR.
Step 7: Save the configuration
Click Save and confirm that the configuration is saved successfully.
Once saved, firewall log ingestion is enabled for the selected organization using the defined settings. Firewall logs sent via syslog to the selected log‑receiving device can now be ingested according to the configured parameters.
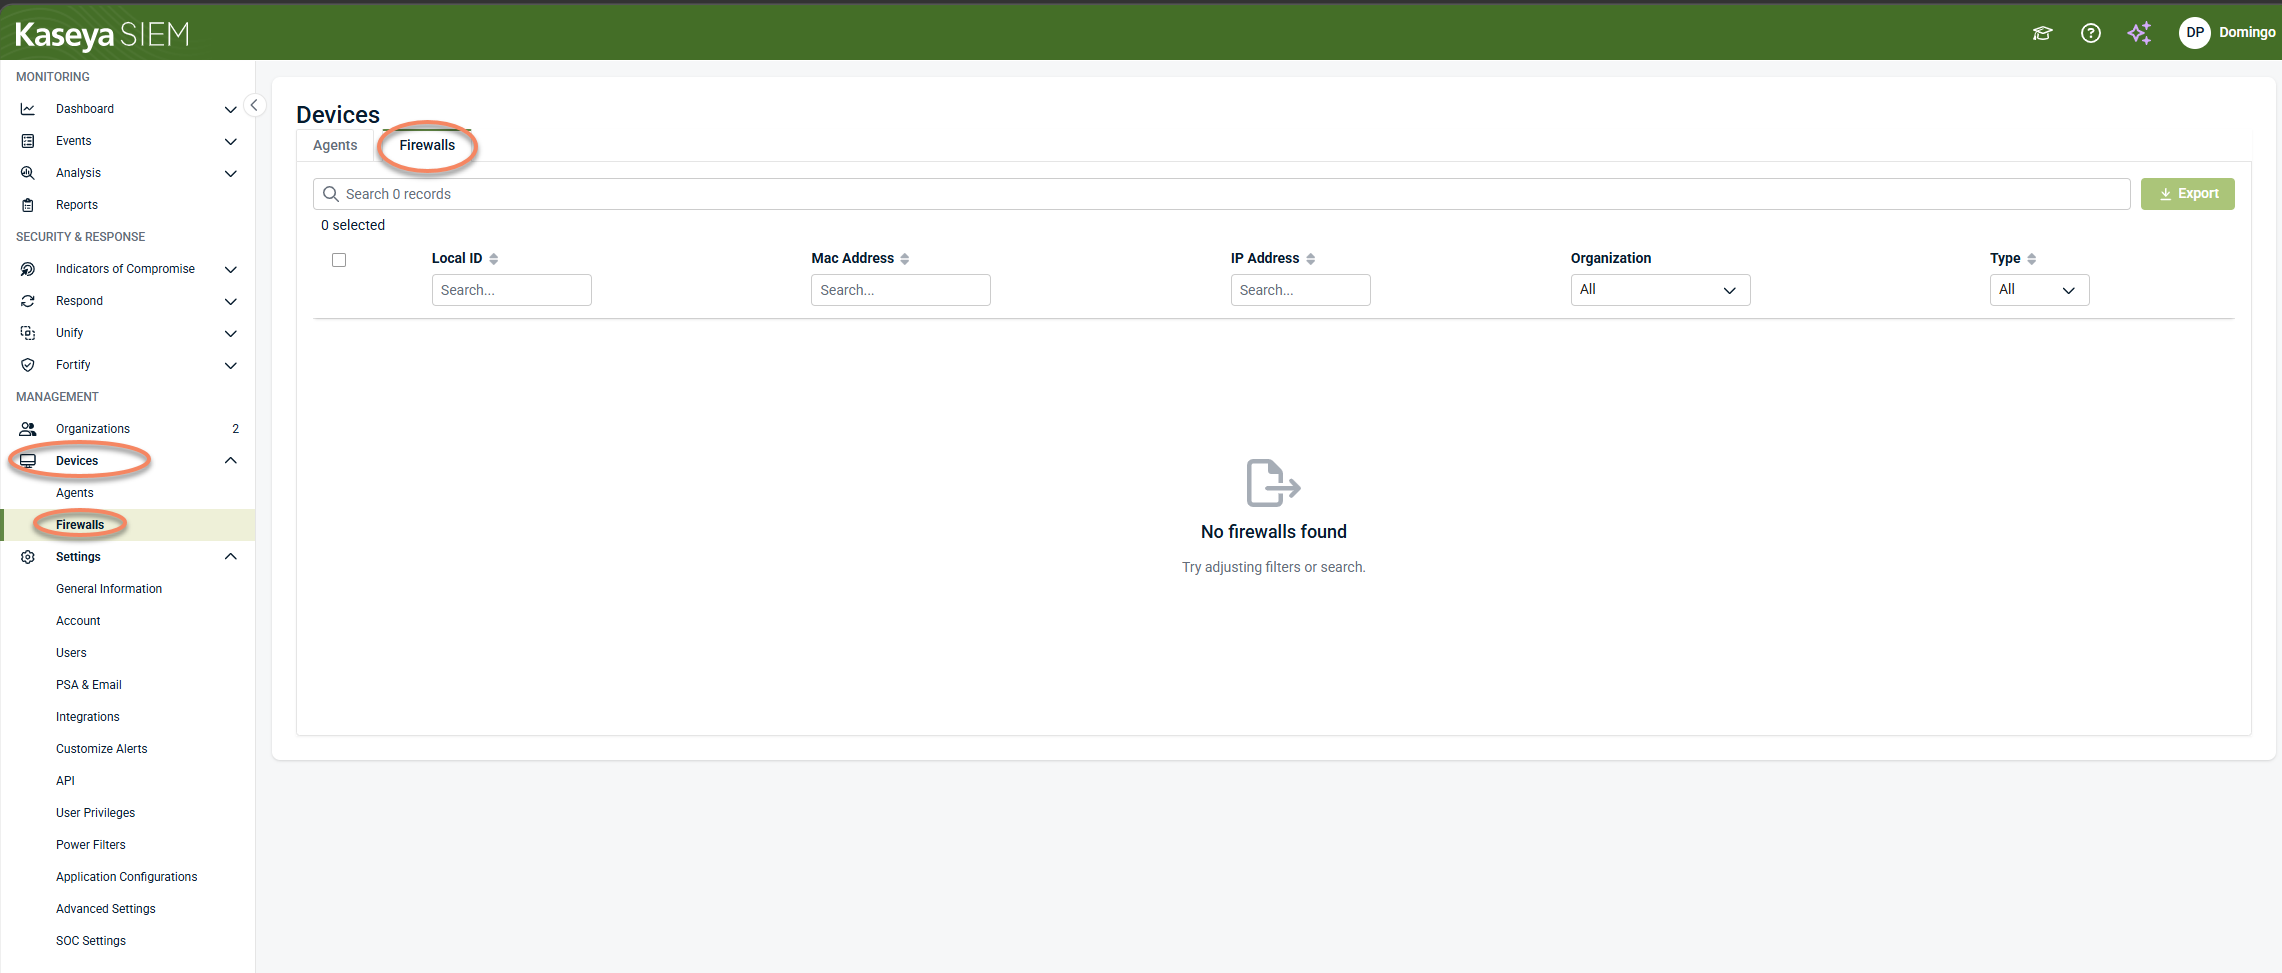
How Devices relate to firewall log ingestion
The Devices > Firewalls area is not used to configure firewall log ingestion. It is used to:
-
Validate that the selected log‑receiving device is online
-
Confirm that the agent is present and operational
-
Provide ongoing visibility and device‑level management
This aligns with the broader Kaseya MDR model: Devices is an inventory and management surface, not a configuration surface.
Vendor considerations
Kaseya MDR supports firewall log ingestion from the same vendors supported in RocketCyber.
Firewall vendors such as Palo Alto, Fortinet, Cisco, and others:
-
Do not appear as applications in the MDR UI
-
Act as external log sources
-
Send logs via syslog to the configured log‑receiving device
Firewall Log Analyzer provides a vendor‑agnostic ingestion path. Vendor‑specific firewall setup steps vary by platform and are intentionally outside the scope of this article.
Supported firewall vendors
Firewall Log Analyzer supports firewall log ingestion from a set of commonly used firewall platforms.
Supported vendors include, but are not limited to:
-
Cisco Meraki
-
Cisco ASA
-
Cisco Firepower
-
Fortinet
-
SonicWall
-
Sophos
-
Untangle
-
Ubiquiti
These platforms can forward telemetry to Kaseya MDR using standard syslog mechanisms.
The list of supported firewall vendors reflects current ingestion capabilities. The specific vendors available in your environment may vary, and the MDR interface remains the authoritative source for supported configuration options.
Related articles
-
Deploying agents: Install agents on supported devices before selecting them as log‑receiving devices
-
Application Configurations: Understand how organization‑level overrides control application settings in Kaseya MDR


