Using the Reports module
The Reporting experience in Kaseya MDR provides structured ways to review, summarize, and export security‑relevant data collected by the platform. Reporting is designed to support visibility, analysis, and documentation across investigations, audits, and operational reviews.
Reporting in Kaseya MDR does not generate alerts, detections, or response actions. Instead, it presents information derived from ingested and processed security data to help teams understand what has occurred, when it occurred, and how activity is distributed across the environment.
For a conceptual explanation of why reporting is separated from detection, investigation, and response, and when reporting should be used, see Reports overview.
Accessing the Reports module
To access the Reports module, select Reports from the side navigation menu.
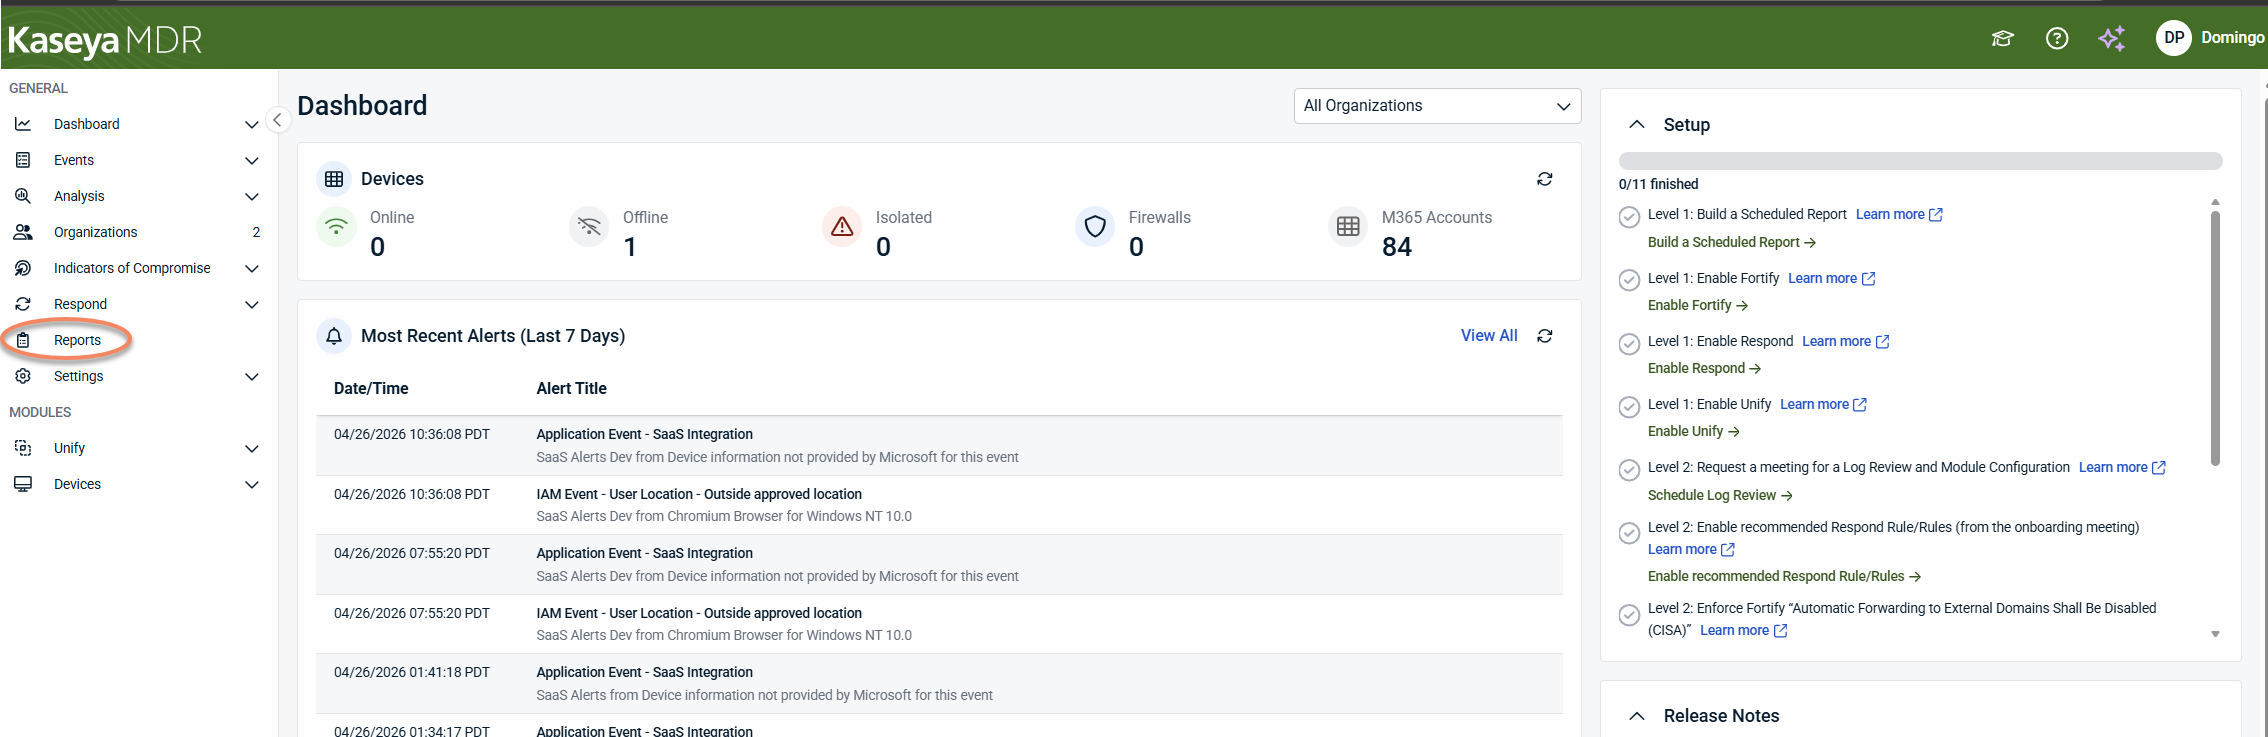
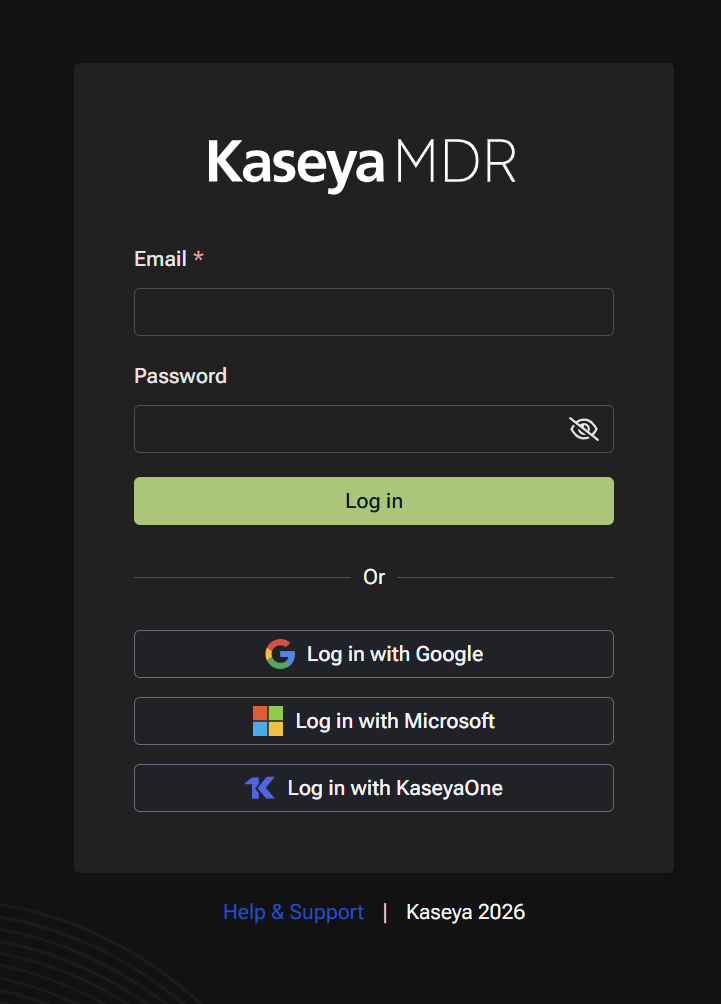
Depending on your environment and authentication state, you may be prompted to authenticate before the Reports module loads.
After authentication, the Reports module opens and displays four primary areas:
-
Risk Dashboard
-
Reports
-
Scheduled Reports
-
Settings
Each area supports a different aspect of reviewing, generating, and managing report data within Kaseya MDR.
Reports and dashboards in this module are intended for review after investigation; for guidance on how reporting fits into the overall MDR workflow, see Reports overview.
Risk Dashboard
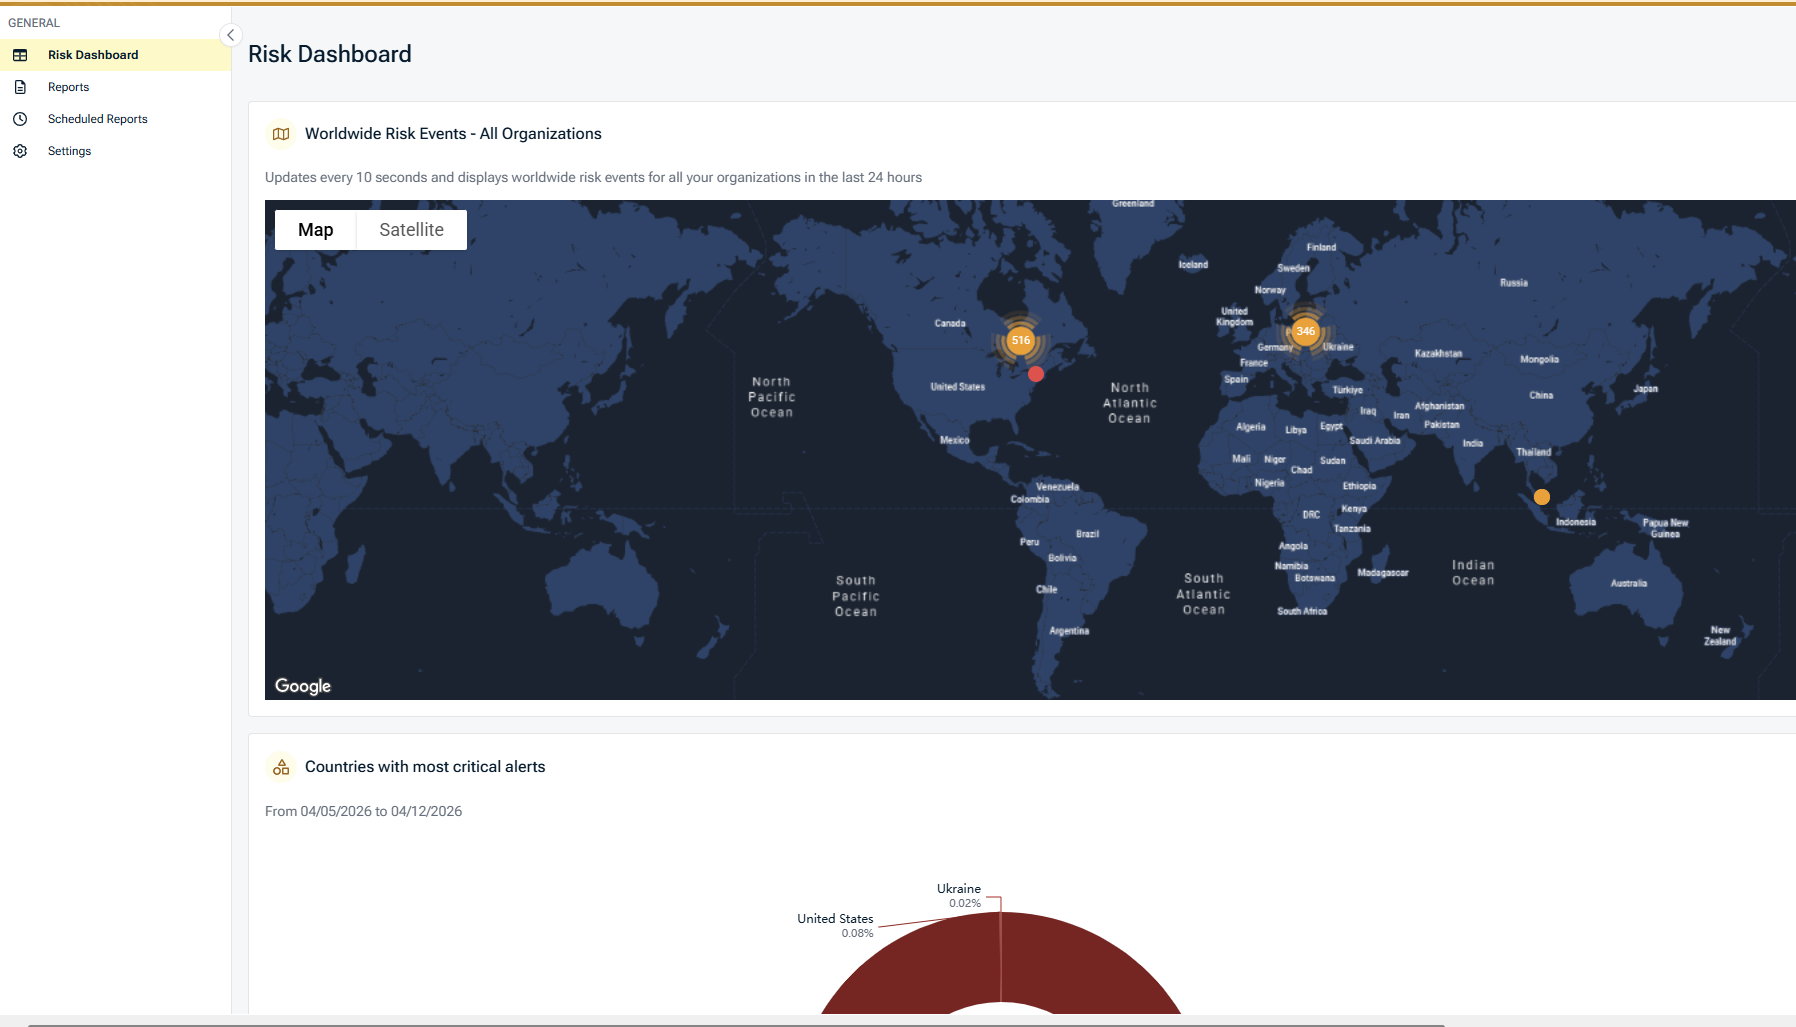
In the Kaseya MDR interface, the Risk Dashboard appears as the first view within the Reports module.
The Risk Dashboard provides a visual, report‑driven overview of security‑relevant activity across your managed organizations. It summarizes report data already collected by the platform to help you review trends, identify concentrations of activity, and prioritize follow‑up.
The Risk Dashboard does not generate alerts, detections, or automated responses. It surfaces aggregated information derived from existing reports and events for visibility and review.
How the Risk Dashboard fits within Reports
The Risk Dashboard is part of the Reports module and complements individual reports by presenting their data in an interactive, visual format. While individual reports provide detailed, point‑in‑time output, the Risk Dashboard helps you observe patterns over time and across organizations, accounts, and locations.
Risk Dashboard widgets
The Risk Dashboard is composed of multiple widgets, each summarizing a specific dimension of reported activity. All widgets respect the selected date range, severity, and drilldown filters.
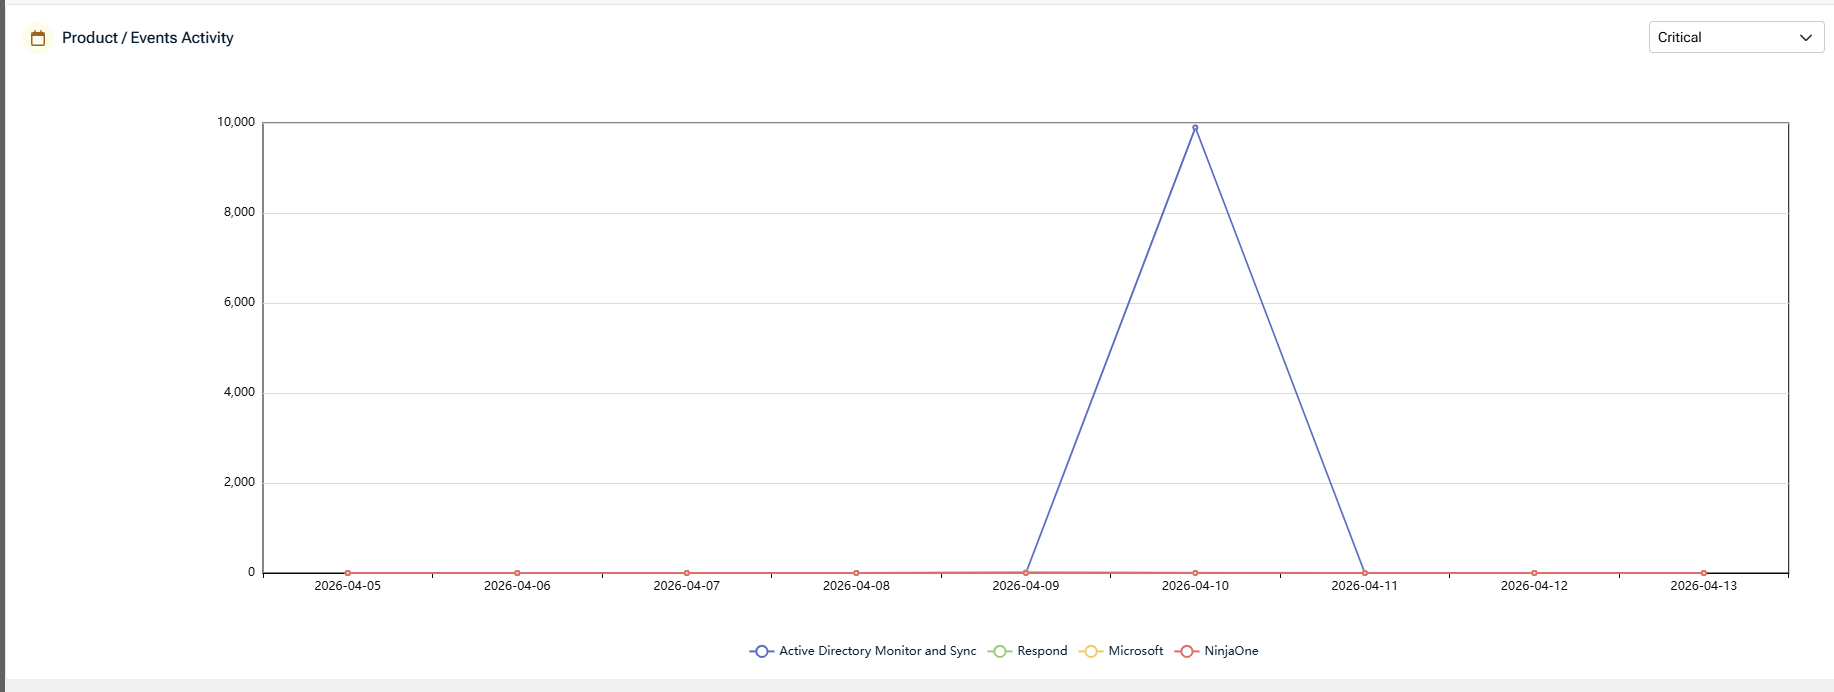
Product / Events activity
This chart shows reported event activity over time, grouped by product or integration (for example, Microsoft).
-
Displays activity trends within the selected date range
-
Helps identify spikes or drops in reported events
-
Supports filtering by severity and product
Use this view to understand when activity occurred, not to interpret root cause.
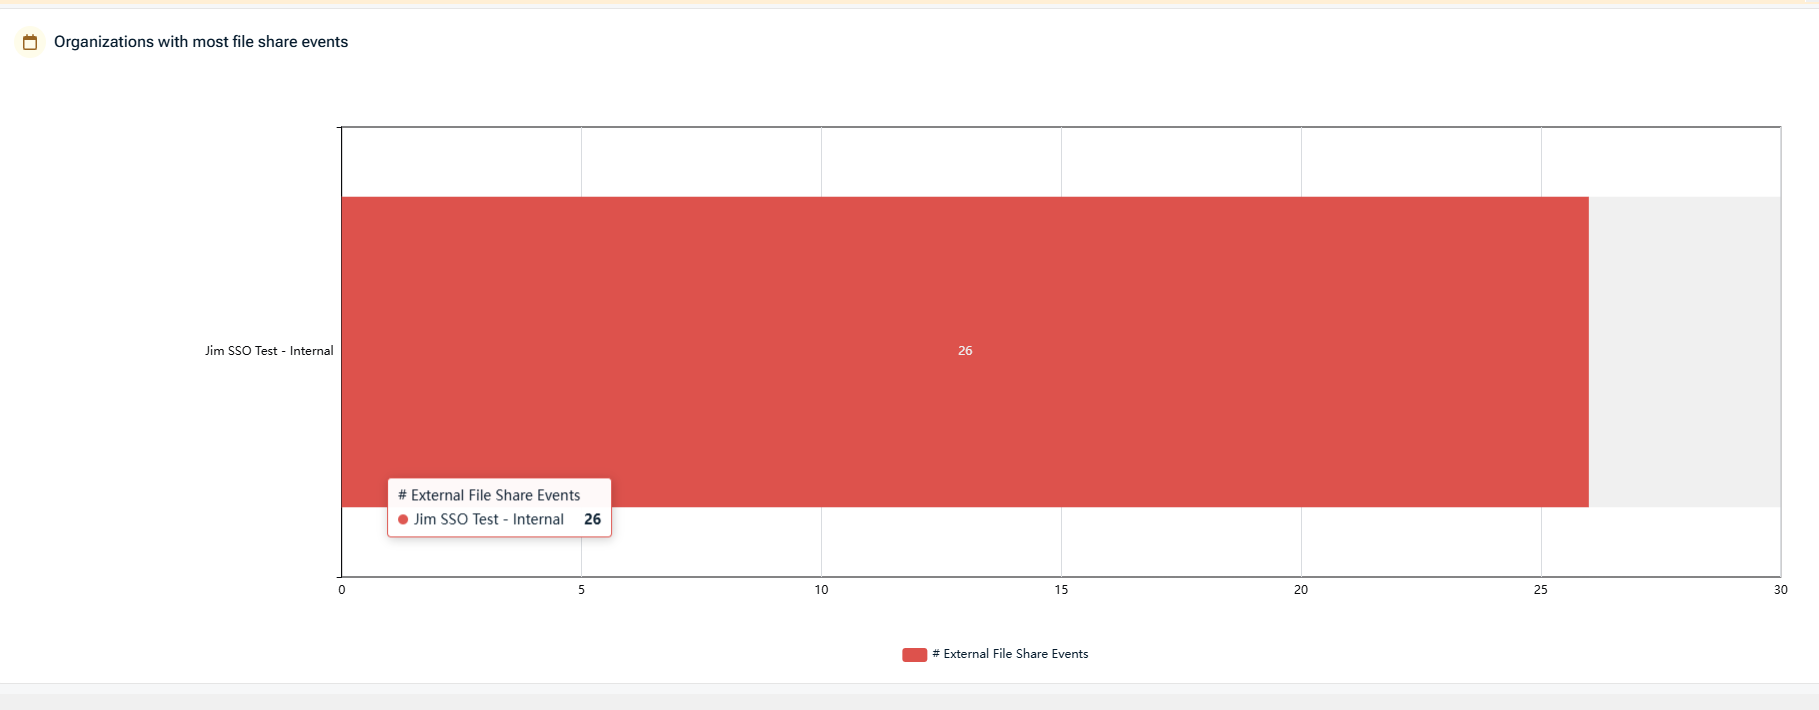
Organizations with most file share events
This widget highlights organizations with the highest number of external file sharing events.
-
Displays organizations ranked by file share event volume
-
Focuses on external file share activity
-
Useful for identifying organizations that may require configuration review or policy validation
The widget reflects reported events only; it does not assess intent or risk level.
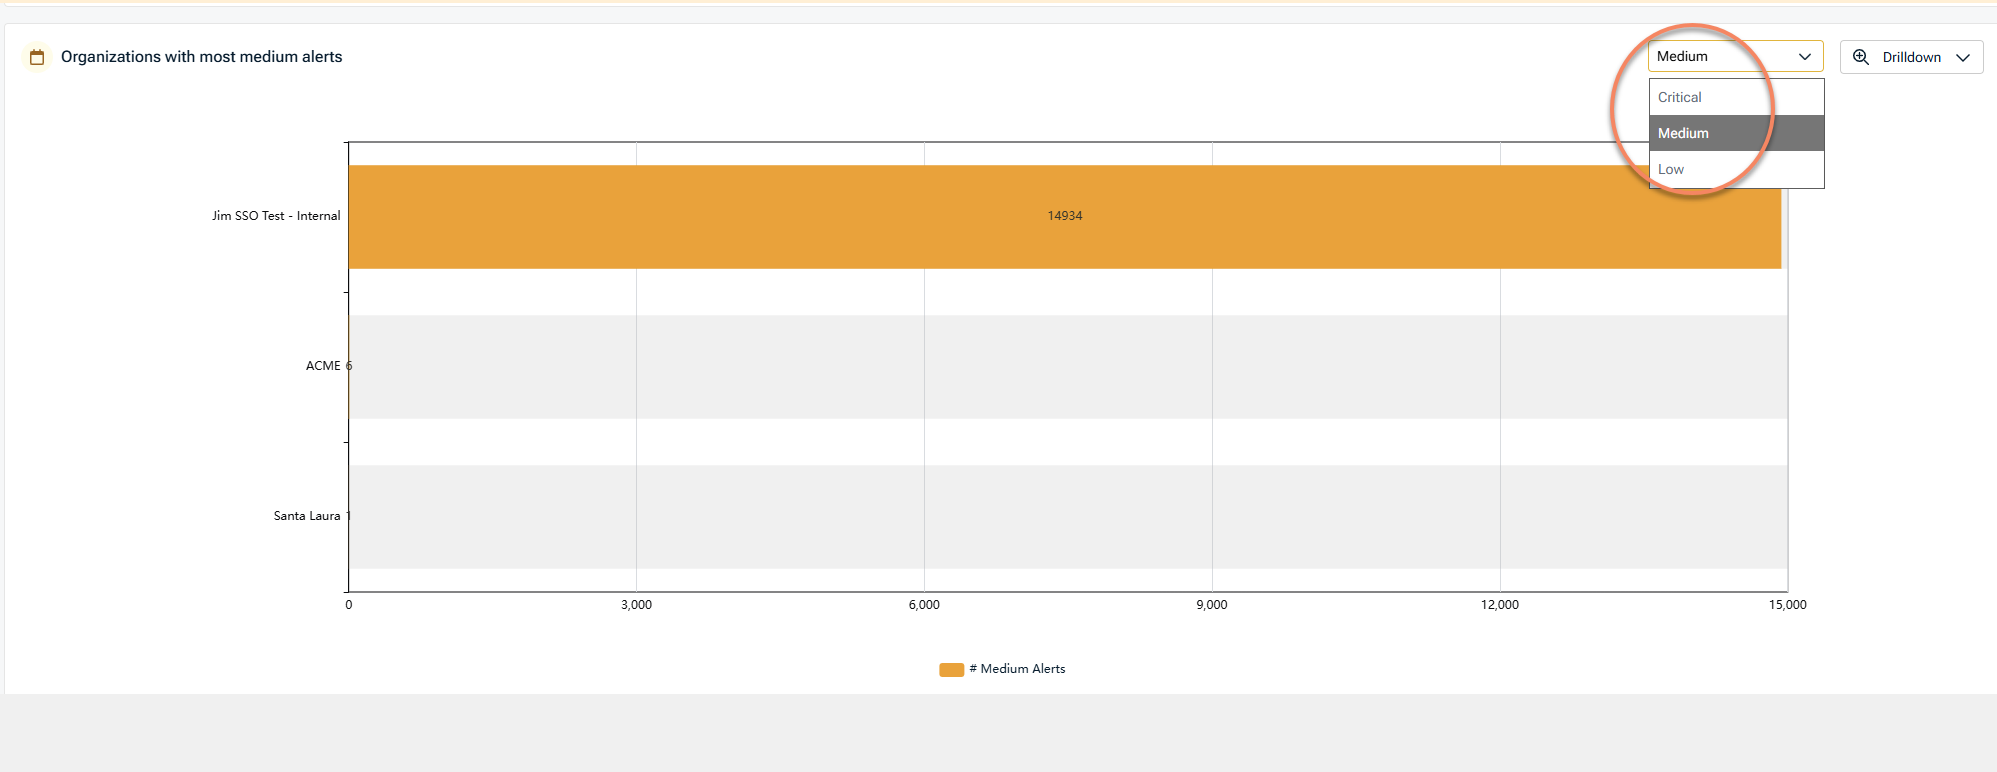
Organizations with most (severity level) alerts
This chart summarizes organizations with the highest number of alerts, based on the selected severity level (Critical, Medium, or Low).
-
Severity can be adjusted using the selector
-
Helps identify where alert volume is concentrated
-
Supports drilldown for further review
This view is intended for prioritization, not incident confirmation.
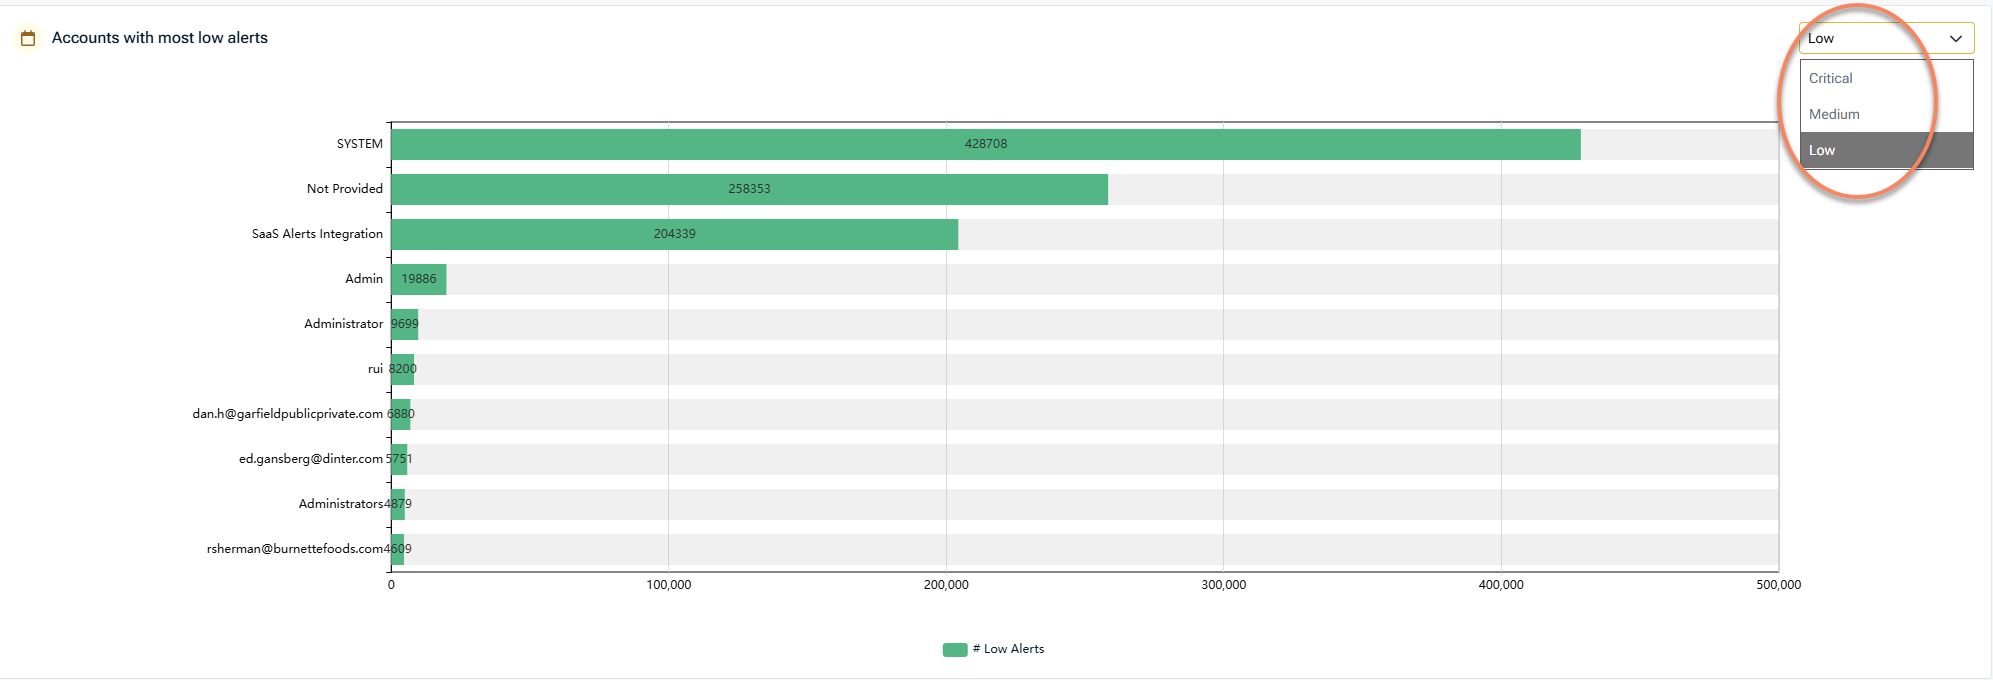
Accounts with most (severity level) alerts
This widget displays accounts associated with the highest number of alerts, based on the selected severity level (Critical, Medium, or Low).
-
Severity can be adjusted using the selector
-
Aggregates alert counts per account
-
Useful for identifying accounts that may require closer inspection
-
Supports filtering and drilldown
Account‑level visibility helps guide follow‑up review or investigation using more detailed reports or the Analysis experience.
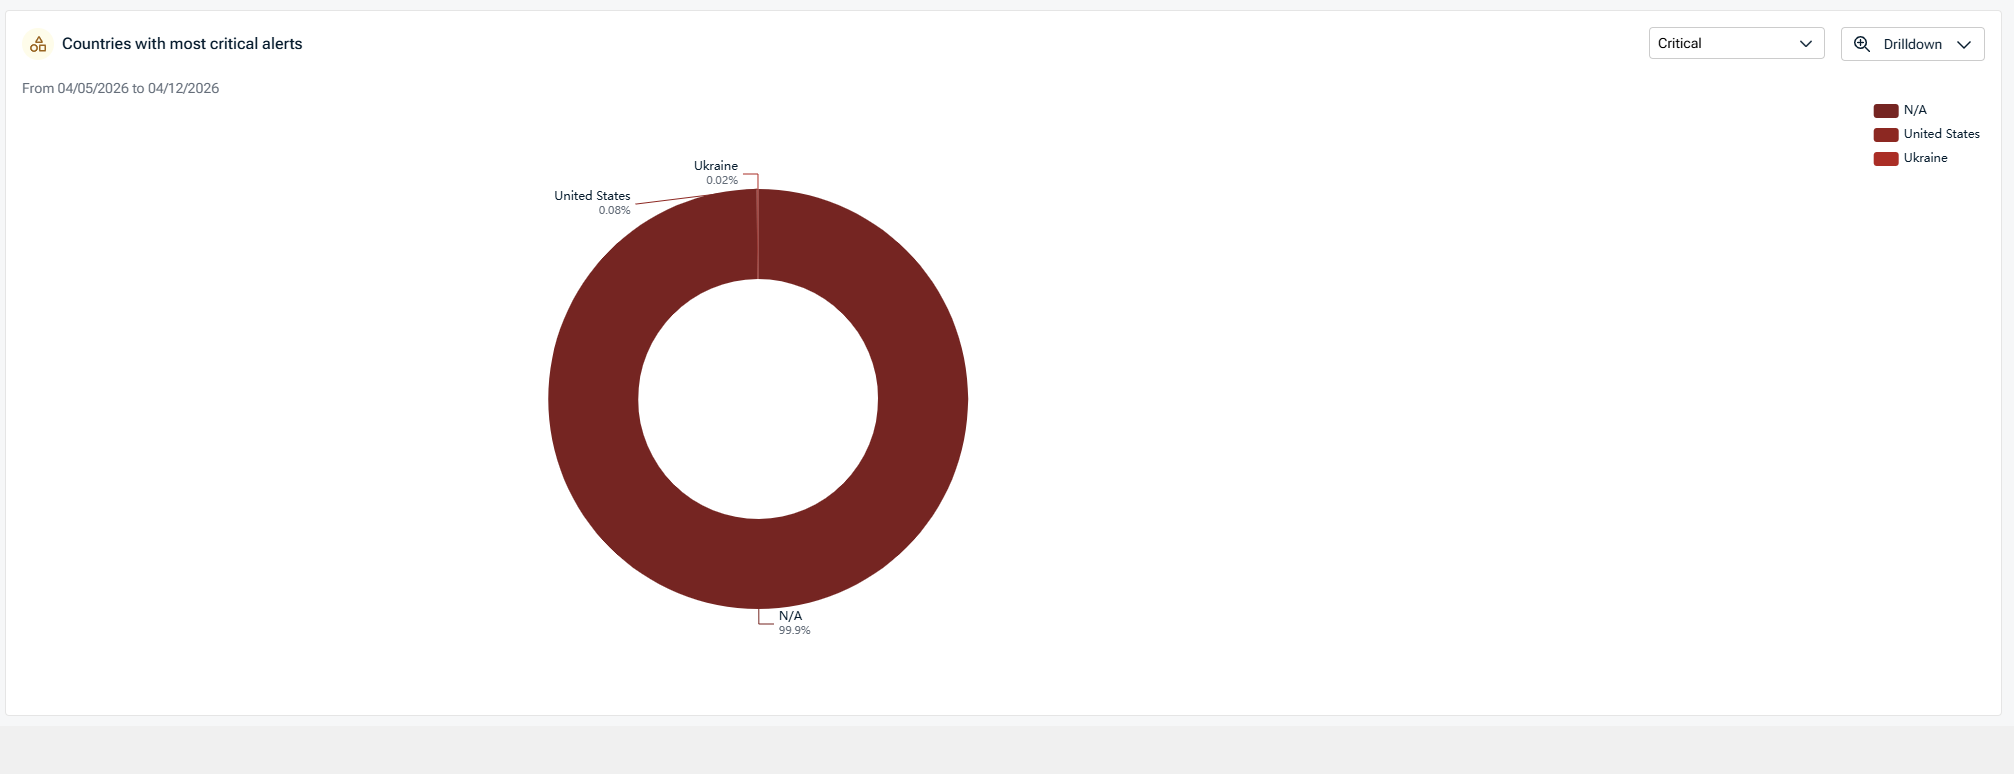
Countries with most critical alerts
This visualization groups critical alerts by geographic location.
-
Displays alert distribution by country
-
Useful for identifying geographic concentration of reported activity
-
Intended for contextual awareness, not attribution
Geographic data reflects reported metadata and may vary based on integration and data source.
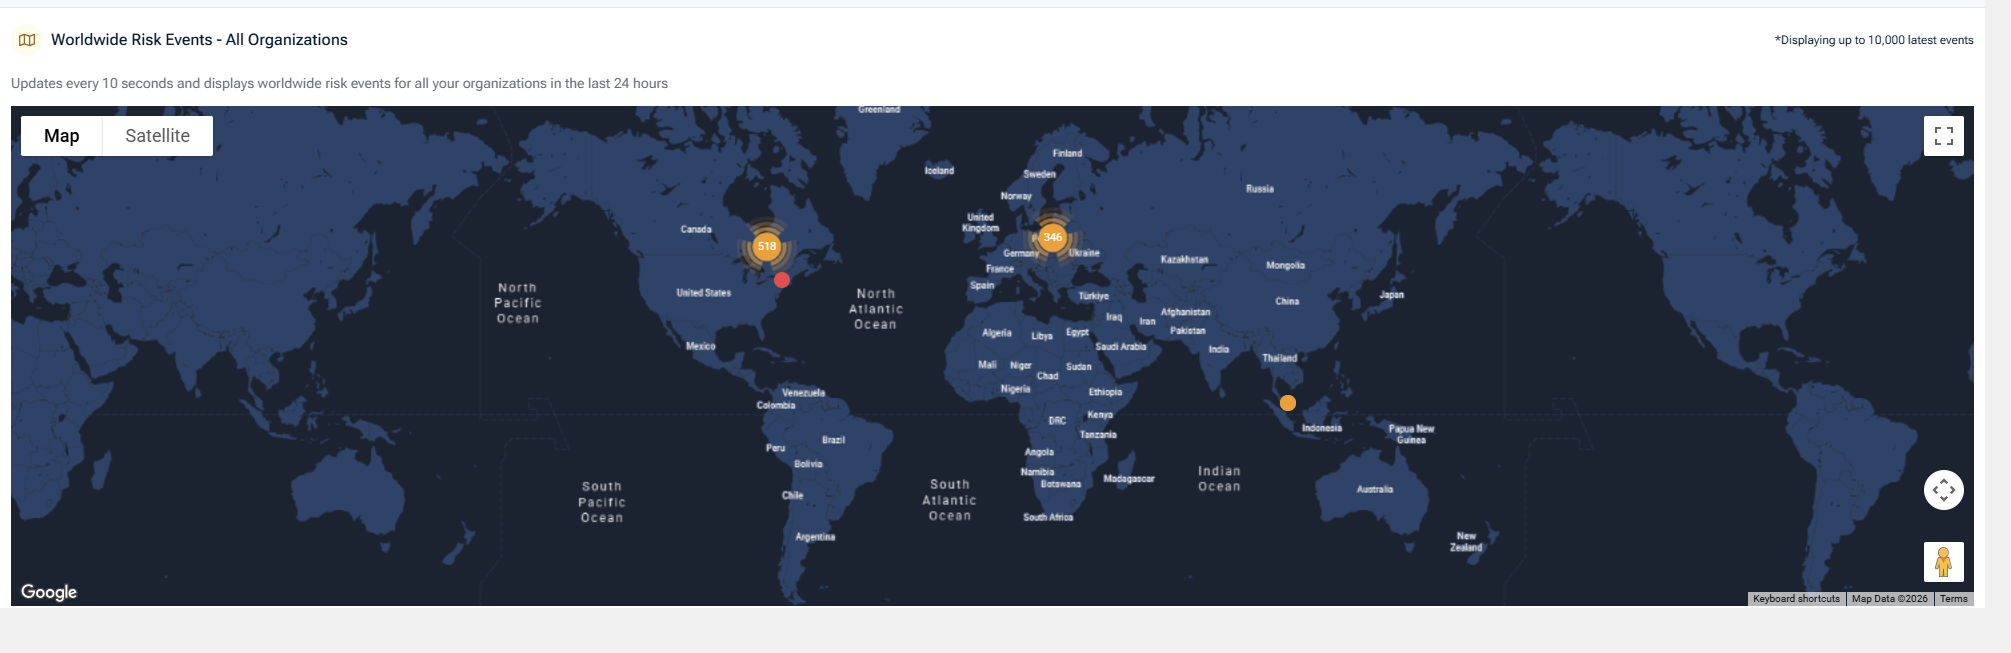
Worldwide risk events map
The map view displays reported risk events across all organizations on a global map.
-
Updates automatically based on selected date range
-
Supports map and satellite views
-
Helps visualize geographic distribution of recent activity
This view is designed for situational awareness rather than investigation.
Filters and drilldown
Most Risk Dashboard widgets support filtering and drilldown options, allowing you to:
-
Adjust severity levels (Critical, Medium, Low)
-
Filter by organization, account, or product
-
Drill into underlying data for further review in reports
Drilldown actions transition you from summary views to more detailed report data, not directly into response actions.
Relationship to the Respond module
The Respond module enables you to define and execute response actions based on alerts and events surfaced by the platform.
While the Risk Dashboard itself is read‑only, it helps inform decisions about when to:
-
Review detailed reports
-
Validate configurations
-
Trigger or refine Respond rules
Respond workflows are configured and executed outside of the Reports module.
Key takeaways
-
The Risk Dashboard provides a visual summary of reported security activity.
-
All data is derived from existing reports and events.
-
The dashboard supports trend analysis and prioritization, not detection or response.
-
Respond workflows are configured and executed outside of the Risk Dashboard.
Reports
The Reports tab provides access to individual reports that summarize security‑related data collected by the platform. Reports present structured, point‑in‑time views of activity, configuration state, or operational metrics, depending on the report type.
Reports are organized into categories to help you quickly locate the type of information you need. Each report can be generated on demand for a selected organization and date range.
Executive Reports provide high‑level summaries intended to support review, communication, and oversight. These reports aggregate data across users, applications, or organizations to present trends and key indicators in a concise format.
Executive Reports are commonly used for:
-
High‑level security posture reviews
-
Periodic reporting to stakeholders
-
Identifying areas that may require deeper follow‑up using other reports or modules
Available executive reports
The following Executive Reports are available, depending on integrations and configuration:
-
Account Detail: Summarizes activity associated with individual accounts over a selected time period
-
Externally Shared Files: Lists external file‑sharing activity observed within the selected organization and date range
-
File Share Events: Displays file‑sharing events to provide visibility into sharing activity trends
-
Organization Vulnerability Assessment: Compares organizational configuration against available benchmarks. Availability depends on active integrations
-
Respond Rule Trigger Report: Summarizes Respond rule trigger activity for supported integrations. This report is only available for organizations with an active Respond connection
-
SaaS Cyber Assessment: Provides a summarized view of selected security‑related activity across the organization
-
SaaS Risk Report: Presents aggregated risk‑related metrics to support high‑level review
-
Threat Mitigation: Displays progress information related to mitigation activity, where supported by integrations
NOTE Some Executive Reports are only available when specific integrations (such as Microsoft or Fortify) are enabled. Availability indicatores are shown directly in the report list.
Generating an executive report
To generate an Executive Report:
-
Select Reports from the side navigation menu
-
Under Executive Reports, select the report you want to run
-
Select the organization and date range
-
Select Run Report
The report loads with interactive charts and summary tiles based on the selected criteria.
To return to the main Reports list, click Reports again from the side navigation menu.
Printing and sharing reports
After a report is generated, you can distribute it using built‑in sharing options:
-
Use Print Report to generate a printable version of the report for offline review or distribution.
-
Use Share Report to generate a secure, read‑only link to the report.
When sharing a report, a secure link is generated along with a unique access key. The link automatically expires after a defined period.
Recipients can view and print interactive charts, and they cannot modify the date range or report parameters
You can optionally hide partner branding before generating the secure link.
Shared reports are protected using a unique access key and an automatically enforced expiration date. These controls help ensure that shared report access is time‑bound and view‑only.
Executive Reports do not generate alerts or detections. They do not trigger response actions, and they do not change underlying configuration or data collection
They present summarized information derived from existing data for review and communication purposes.
Operational Reports provide detailed, activity‑level views intended to support day‑to‑day operations, monitoring, and administrative review. These reports focus on alert activity, application usage, integrations, and account state rather than high‑level summaries.
Operational Reports are typically used by administrators and operational teams to:
-
Review alert volumes by severity
-
Validate application and account activity
-
Monitor integrations and synchronization status
-
Support routine operational reviews and follow‑up
Available operational reports
The following Operational Reports are available, depending on integrations and configuration:
-
Billing Details: Displays billing‑related information for the selected period, including organization counts, account totals, and billable account details
-
Critical Alerts: Lists alerts classified as critical within the selected organization and date range
-
Medium Alerts: Lists alerts classified as medium severity within the selected organization and date range
-
Low Alerts: Lists alerts classified as low severity within the selected organization and date range
-
Enterprise Applications Details: Displays activity related to enterprise applications, including application usage and related events
-
Foreign Applications Details (Shadow IT): Provides visibility into application activity that may indicate unapproved or externally connected applications
-
PSA Account Sync Report: Displays billable account synchronization activity related to PSA integrations for the selected date
-
PSA Organization Mapping Report: Shows organization‑level mapping status between SaaS Alerts and connected PSA systems, including agreement and synchronization state
-
Stale Devices Report: Identifies devices that have not reported recent activity within the selected period, based on available data.
NOTE Report availability and displayed fields depend on enabled integrations and the data available for the selected organization and date range.
Generating an operational report
To generate an operational report:
-
Select Reports from the side navigation menu.
-
Under Operational Reports, select the report you want to run.
-
Select the required organization and date parameters.
-
Select Run Report.
The report loads with tables, filters, and summary information based on the selected criteria.
Filtering and exporting data
Operational reports typically include filtering options that allow you to narrow results by fields such as:
-
Organization
-
Product or integration
-
Account
-
Date or time range
Many operational reports also support exporting results for offline review or further analysis.
Operational reports support the same sharing options as Executive Reports.
After generating a report, you can:
Use Print Report to generate a printable version
Use Share Report to create a secure, read‑only link
Shared reports use a unique access key and automatically expire after a defined period. They allow recipients to view and print data, but do do not allow modification of report parameters.
When viewing an individual operational report, select Reports from the side navigation menu to return to the main Reports list.
Configuration Reports provide visibility into account‑level, device‑level, and security‑related configuration state for supported integrations. These reports are intended to help administrators review current settings, identify gaps, and validate configuration consistency across organizations.
Configuration Reports reflect the state of data at the time the report is generated. They do not change configuration, enforce policy, or apply remediation.
Available configuration reports
The following Configuration Reports are available, depending on integrations and licensing:
Account List
Provides a list of user accounts for the selected organization, along with key account attributes such as:
-
Account type
-
Login status
-
Last activity
-
MFA status
Filtering options allow you to narrow results by account type, login state, activity, or MFA configuration.
This report is commonly used to review account posture and identify accounts that may require follow‑up.
Account Mailbox Forwarding Rule Report
Displays mailbox forwarding rules configured for user accounts.
For each account, the report shows:
-
Whether forwarding rules are present
-
Rule descriptions
-
Last sync date
This report supports review of mailbox configuration state and visibility into forwarding behavior.
Availability: This report is only valid for Microsoft 365 organizations.
For details about required permissions, data availability, and expected behavior, see Mailbox Forwarding Rule Report.
Device Mapping List
Provides a summary view of device mapping status for the selected organization.
The report includes:
-
A visual breakdown of mapped, unmapped, shared, and ignored devices
-
Counts for each device category
-
This report is used to review device coverage and mapping completeness.
Availability: This report is only valid for organizations with an active Unify connection.
Fortify Actions Audit Report
Displays audit information related to actions executed through Fortify, including configuration and action history where applicable.
This report is used to review Fortify‑related activity for organizations with an active Fortify connection.
Availability: This report is only valid for organizations with an active Fortify connection.
MFA Settings Report
Provides visibility into multi‑factor authentication (MFA) configuration for supported platforms.
For each account, the report may display:
-
MFA status (enabled or disabled)
-
Authentication methods
-
Administrative role indicators
-
Last update timestamps
This report supports review of MFA configuration state and helps identify accounts without MFA enabled.
Availability and notes:
-
This report is only valid for supported Microsoft 365 organizations
-
Blocked and guest accounts do not appear in this report
-
Data reflects information available through the connected platform APIs
For details about data sources, account inclusion, and differences from Microsoft admin views, see Understanding the MFA Report.
Generating a configuration report
To generate a configuration report:
-
Select Reports from the side navigation navigation.
-
Under Configuration Reports, select the report you want to run.
-
Select the required organization and parameters.
-
Select Run Report.
The report loads with tables, visual summaries, and filtering controls based on the selected criteria.
Filtering, exporting, and viewing details
Configuration Reports typically support:
-
Column‑level filtering
-
Search within results
-
Exporting data for offline review
Some reports also allow you to view additional configuration details, such as rule definitions or JSON‑formatted data, directly from the report interface.
Configuration Reports support the same distribution options as other report types.
After generating a report, you can:
-
Select Print Report to generate a printable version
-
Select Share Report to create a secure, read‑only link
Shared reports are protected by a unique access key, automatically expire after a defined period, and allow viewing and printing only. They do not allow changes to report parameters.
When viewing an individual configuration report, select Reports from the left navigation menu to return to the main Reports list.
Configuration Reports do not modify account, device, or security settings. They do not enforce policies or trigger alerts or response actions.
They provide visibility into configuration state to support review and decision‑making.
The Scheduled reports tab allows you to send predefined reports to selected recipients on a one‑time or recurring basis. This section explains how scheduling works and where scheduling options are configured. It does not describe the contents or interpretation of individual reports.
Accessing scheduled reports
From the side navigation menu, click Scheduled Reports.
You are taken to the Scheduled Reports page, where existing schedules (if any) are listed and can be filtered by report, organization, schedule type, or frequency.
Creating a new scheduled report
-
On the Scheduled Reports page, select + New Schedule.
-
The Create a new scheduled report panel opens.
This panel is divided into three sections: Schedule details, Report details, and Recipients.
Schedule details
Use this section to define when the report is sent
-
Schedule type
-
Recurring: Sends the report repeatedly based on the selected frequency
-
One time: Sends the report once on a future date
-
NOTE Choosing Recurring will send the report at the beginning of the preferred frequency at 12:00 AM UTC time zone.
EXAMPLE: Scheduled weekly reports will be sent every Monday at 12:00 AM UTC
-
Frequency: Select how often the report is generated (for example, monthly). The available options depend on the selected schedule type.
-
Report sending date: For recurring schedules, this setting determines the day the report is sent within the selected frequency.
Report details
Use this section to define what is included in the scheduled delivery.
-
Report name: Select the report to be sent. Only existing reports appear in the list
-
Hide partner branding (optional): Enable this option if you want to exclude partner branding from the generated report.
Recipients
Use this section to define who receives the report.
-
To: Primary recipients
-
CC: Additional recipients copied on the report email
-
BCC: Recipients who receive the report without being visible to other recipients
By default, MSP users appear in the recipient list. You can also add external email addresses by entering the address and selecting Add.
NOTE Ensure that only intended recipients are included before saving the schedule.
After completing all required fields, select Save. The scheduled report appears in the Scheduled Reports list.
Managing scheduled reports
From the Scheduled Reports page, you can:
-
View existing schedules
-
Filter schedules by report, organization, schedule type, or frequency
-
Edit or delete a schedule as needed
Key takeaways
-
Scheduled reports automate report delivery without changing the underlying report
-
Schedule type and frequency control when a report is sent
-
Recipient settings control who receives the report.
The Settings tab
The Settings tab controls branding options that apply to reports generated from the Reports module. These settings affect how reports appear when they are viewed, shared, or scheduled, but do not change report content, data collection, calculations, and availability.
Branding settings
Branding settings allow you to customize the visual appearance of reports and dashboards.
The following options are available:
-
Application color: Select the primary color used across the reporting interface. This color is applied to visual elements within reports and dashboards
-
Logo: Upload a logo to be displayed within reports and dashboards. The uploaded logo is used in report headers and visual layouts.
Supported image formats and size limits are shown in the interface at upload time. Recommended dimensions are provided to ensure proper display
-
Report branding options: Control how Kaseya MDR branding appears in reports. You can remove Kaseya MDR co‑branding from reports. This setting applies when reports are viewed, shared, or scheduled.
Scope and behavior
Branding settings apply only to report presentation. They do not affect report content, data collection, or calculations, and they do not change which reports are available. Changes made in the Settings tab are reflected in reports generated after the settings are saved.
To return to the main Reports module, select Reports from the side navigation menu.
Summary
The Reports module provides multiple ways to review, share, and manage report data:
-
Risk Dashboard offers high‑level visual summaries for situational awareness.
-
Reports provides access to individual Executive, Operational, and Configuration reports.
-
Scheduled Reports allows you to automate report delivery without changing report content.
-
Settings controls branding options that affect how reports are presented.
Together, these areas support reporting, review, and distribution workflows without affecting underlying data collection, detection, or response behavior.
Related articles
-
Reports overview: Explains the purpose of reporting in Kaseya MDR, where reporting fits in the investigation lifecycle, and what reporting is and is not used for.
-
Investigating activity using the Analysis page: Describes how investigations establish timelines, context, and related activity before reports and dashboards are used for review, documentation, or sharing.
-
Understanding the MFA Report: Provides report‑specific interpretation guidance, including data sources, account inclusion rules, and reasons report results may differ from Microsoft admin views.
-
Mailbox Forwarding Rule Report: Explains prerequisites, permissions, and expected behavior for mailbox forwarding rule reporting, including common scenarios where no results appear.


