Integration: Kaseya MDR and Datto EDR
Kaseya MDR
NAVIGATION Settings > Integrations > Datto EDR, or
NAVIGATION Organizations > Edit Organization > Applications > + New Application > Datto EDR
PERMISSIONS Permission to manage integrations or organization applications in Kaseya MDR
Datto EDR
NAVIGATION Admin > Users & Tokens > API Tokens
PERMISSIONS Administrative access to Datto EDR
Overview
This integration connects Datto EDR to Kaseya MDR and makes endpoint telemetry available for investigation and correlation.
Datto EDR activity is associated with organizations through mapping. Once mapped, endpoint activity becomes available in alerts and investigations. This integration focuses on connection, organization mapping, and data availability.
This article does not describe detection logic, response actions, SOC workflows, or Datto EDR administration.
Relationship to endpoint and infrastructure sources
Datto EDR is an endpoint data source that provides endpoint and infrastructure telemetry to Kaseya MDR.
In Kaseya MDR, endpoint and infrastructure sources contribute device‑level and system activity used for investigation and correlation. Datto EDR provides this type of telemetry as part of the broader set of endpoint and infrastructure data sources.
For an overview of how endpoint and infrastructure sources appear in Kaseya MDR, how endpoint activity becomes visible, and how endpoint telemetry differs from other data source types, see Endpoint and infrastructure sources.
Prerequisites
Before configuring the integration:
-
You must have administrative access to Datto EDR.
-
You must be able to create an API token in Datto EDR.
-
You must have permission to manage integrations or organization applications in Kaseya MDR.
Use case
A managed service provider uses Datto EDR across multiple customer environments.
By connecting Datto EDR to Kaseya MDR once at the partner level and mapping each customer organization, endpoint telemetry becomes available during investigations.
For example:
-
A login alert is investigated in Kaseya MDR
-
Endpoint context from Datto EDR is associated with the alert
-
The analyst uses that context to better understand device state and activity
How Datto EDR integration works in Kaseya MDR
When connected to Kaseya MDR, Datto EDR provides endpoint activity that can be associated with one or more organizations for investigation and correlation.
Datto EDR is connected once at the partner level. Customer onboarding is performed through organization mapping, which determines where Datto EDR activity is visible.
Kaseya MDR observes Datto EDR-generated activity. It does not manage Datto EDR policies, agents, or enforcement settings.
For information about how endpoint‑based detections are used in detection workflows, see Configuring Datto Ransomware Detection.
How to...
To enable the integration, complete the following steps:
-
Open the Datto EDR Connection Wizard using either:
-
Settings > Integrations > Datto EDR > Connect
-
Organizations > Edit organization > Applications > + New application > Datto EDR
These entry points represent alternative ways to start the same configuration process. Both entry points launch the same connection wizard and use the same organization‑mapping process.
If a Datto EDR connection already exists:
-
Do not create a new connection
-
Open the existing integration and manage organization mapping
Kaseya MDR expects you to use the existing connection and manage organization mapping rather than creating a new integration.
-
2. Enter the following:
-
Client Domain
-
API Token
3. Select Next to continue to organization mapping.
This integration also requires setup in Datto EDR:
-
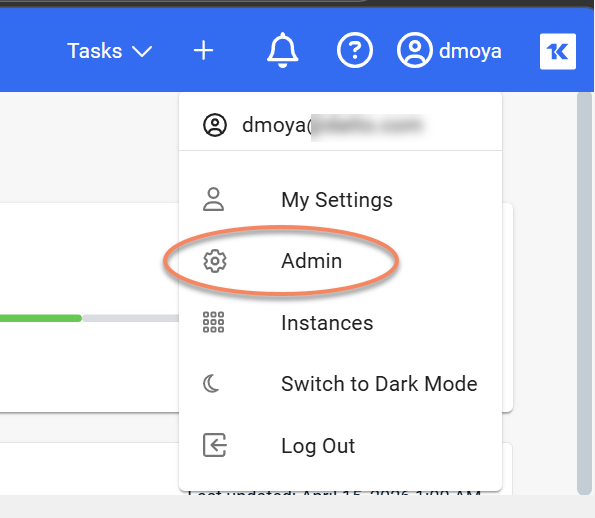
Sign in to Datto EDR
-
Open the user menu and select Admin
-
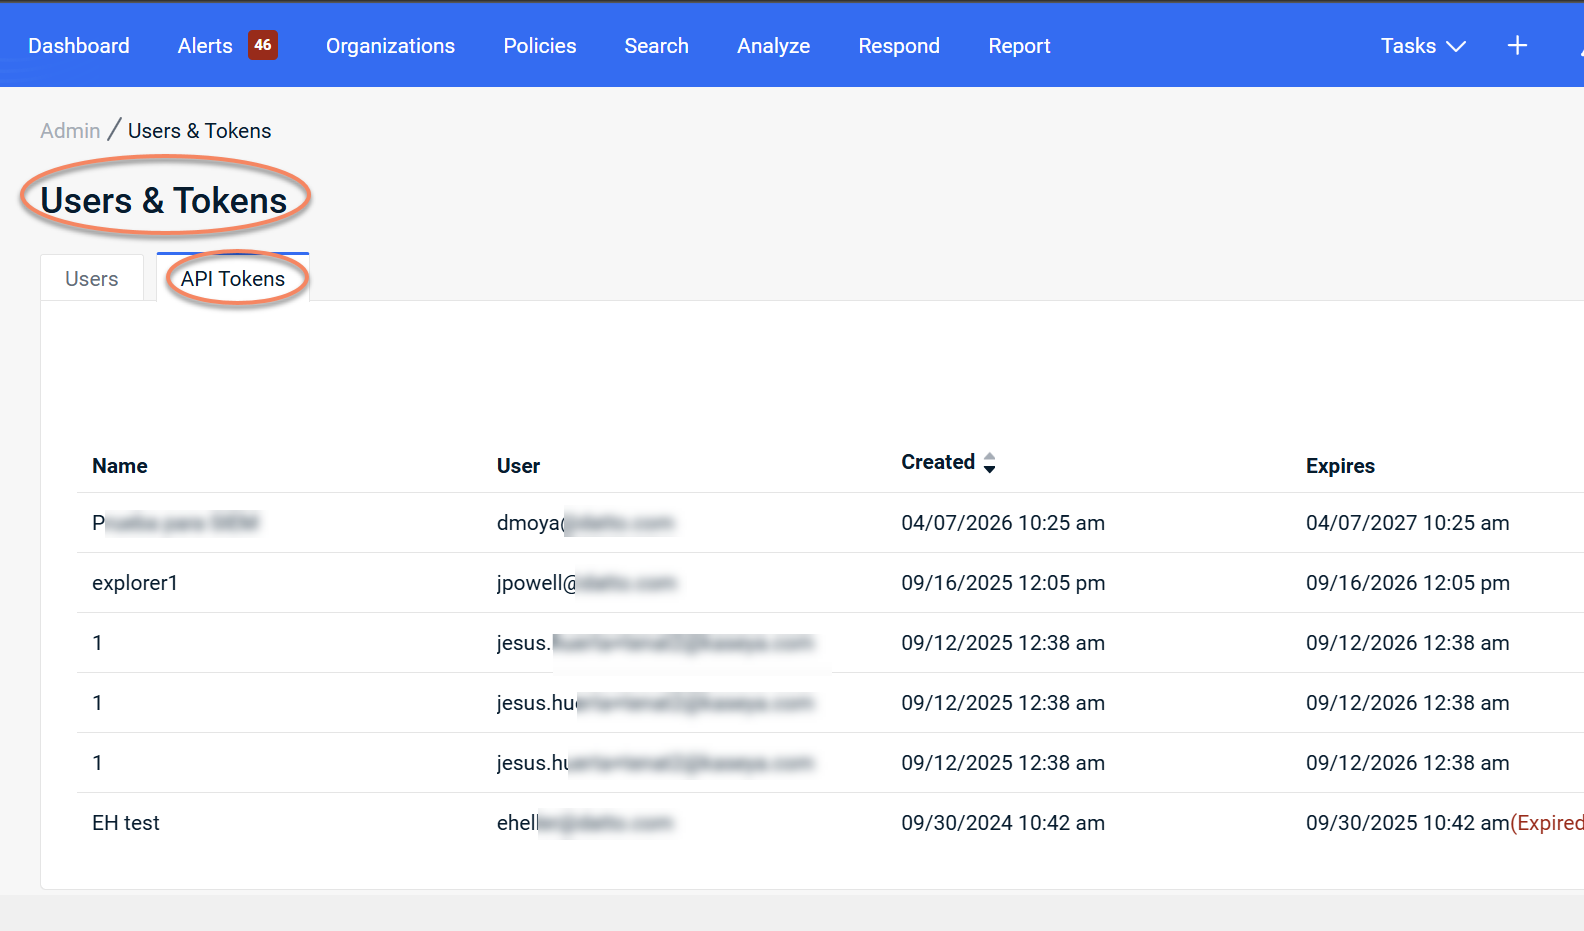
Go to Users & Tokens > API Tokens
-
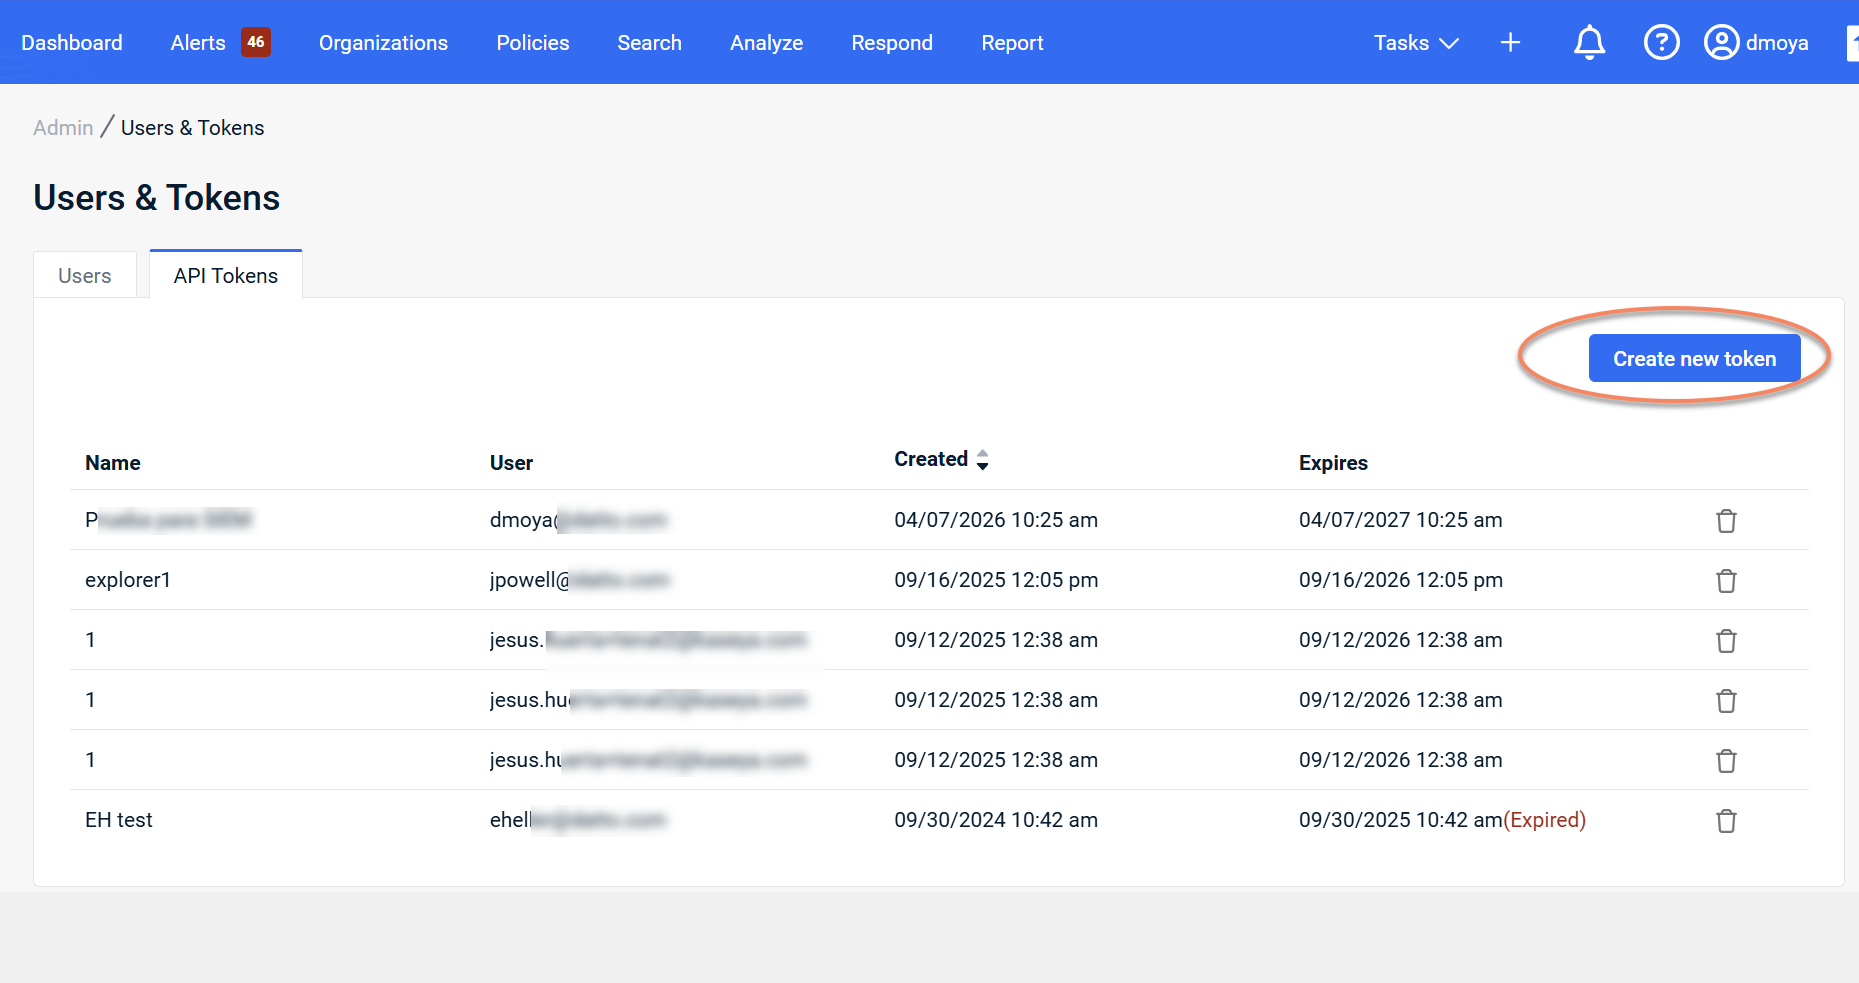
Select Create new token
-
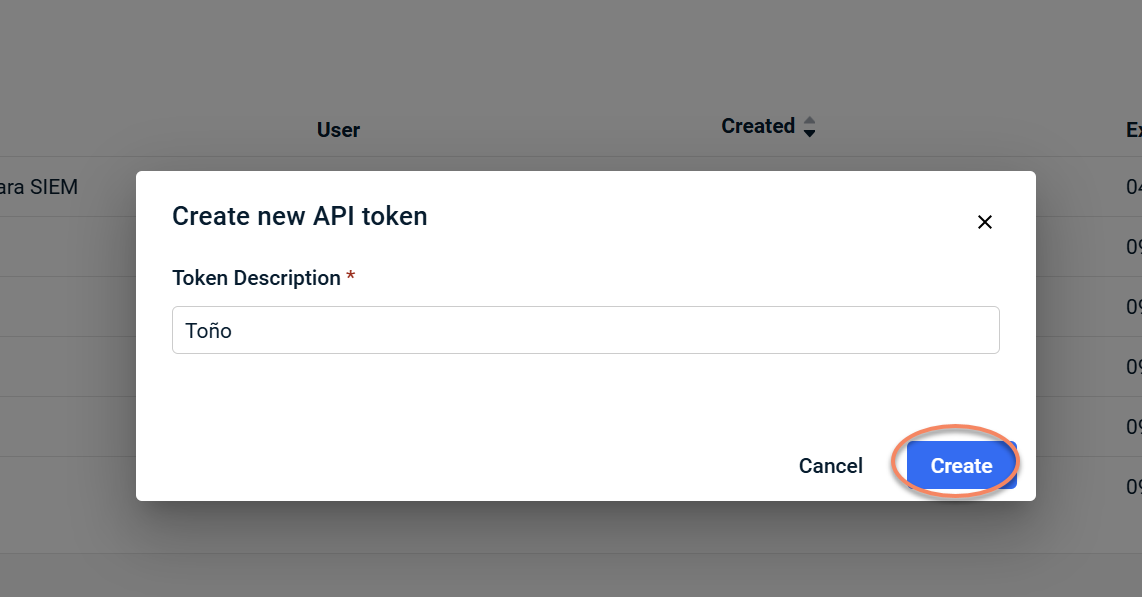
Enter a description and select Create
-
Copy and securely store the token
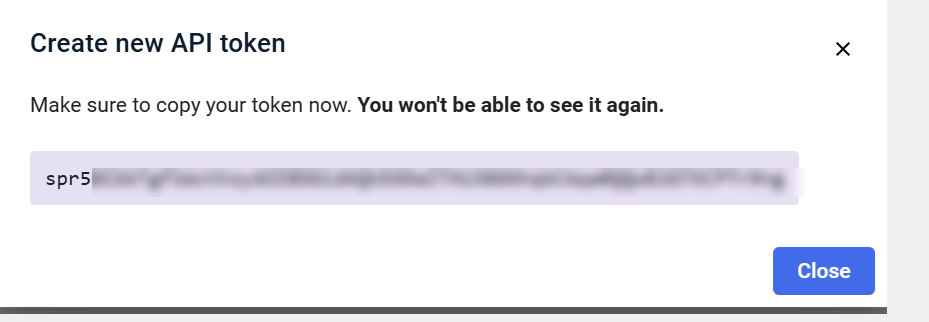
IMPORTANT The token is shown only once and cannot be retrieved later.
Organization mapping determines which Kaseya MDR organizations receive Datto EDR data and where that data appears. Only mapped organizations receive Datto EDR telemetry.
User activity organization
-
Select a User Activity Organization
-
User‑related activity from Datto EDR is associated with this organization and provides context for user activity in Kaseya MDR.
Device organization mapping
-
Map Datto EDR organizations to Kaseya MDR organizations
-
Device‑related activity appears only for organizations that are mapped.
-
Datto EDR organizations that remain unmapped do not receive device telemetry.
You can:
-
Accept suggested matches
-
Manually map organizations
-
Enable automatic mapping when names match exactly (optional)
Select Finish to save the mapping.
Single connection model
Kaseya MDR supports a single Datto EDR connection.
If a Datto EDR connection already exists, attempting to connect the same Datto EDR instance again can result in duplicate events and alerts.
-
The integration is configured once at the partner level.
-
Customer onboarding is performed through organization mapping.
-
Do not create additional Datto EDR integrations for each customer.
If a connection already exists, Kaseya MDR expects you to use the existing connection and manage organization mapping rather than creating a new integration.
Customer onboarding
During onboarding:
-
Do not create additional Datto EDR integrations
-
In onboarding checklists, Connect / Map Datto EDR refers to mapping the organization within the existing connection, not creating a new integration
-
Map the organization
-
Verify that activity becomes available after synchronization
After completing the mapping, follow these steps to ensure data is flowing correctly:
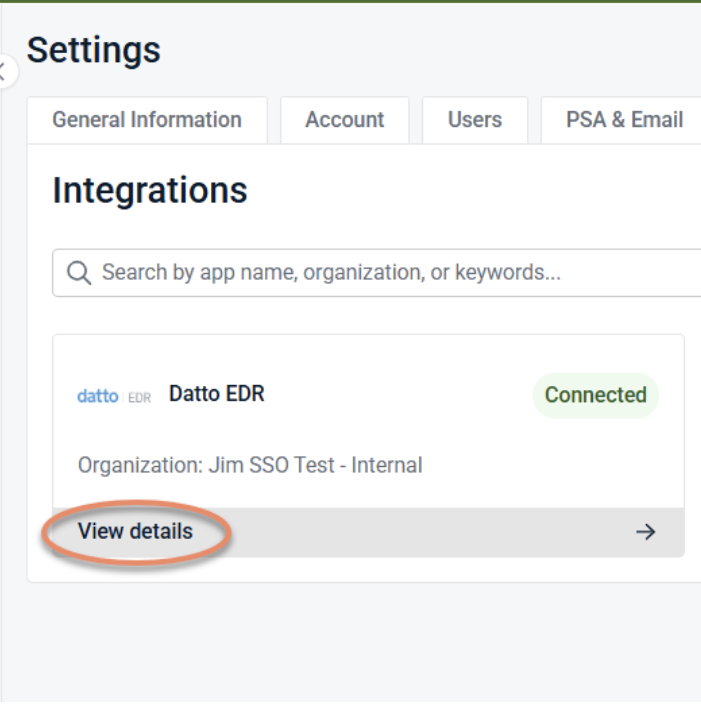
-
Check the Connection Status: Navigate to Settings > Integrations. The Datto EDR card should display a green Connected status.
-
Verify Organization Mapping: Go to the Customer Organization and select the Unify tab. Ensure the correct Datto EDR organization is listed as "Mapped."
-
Confirm Identity Sync: Open the Accounts tab within the integration details. You should see a list of user identities being pulled from Datto EDR. If this list is populated, the API is communicating correctly.
-
Monitor the Analysis Logs: Navigate to the Analysis screen. Look for events where the Source is listed as Datto EDR. (it may take 15–30 minutes for the first set of events to appear after initial mapping).
-
Test "Unify" Correlation: Open a recent login alert for a mapped customer. Under the Device section of the alert details, verify that Datto EDR data appears in alert details for mapped organizations.
Datto EDR telemetry contributes to detection and response configurations managed separately.
For details, see Configuring Datto Ransomware Detection.
For guidance on using Datto EDR with other Kaseya Platform modules and avoiding duplicate alerts or conflicting configurations, see Best practices for integrating with the Kaseya Platform.
To disable the integration:
-
Navigate to the Datto EDR integration.
-
Select Disconnect Application.
-
Confirm the action.
Results
-
Datto EDR activity is no longer associated with organizations
-
Stops Datto EDR activity from being associated with organizations in Kaseya MDR
-
Existing Datto EDR deployment is unchanged
-
Configuration in Datto EDR is not affected
If Datto EDR is configured at the partner level, disconnecting it affects all organizations mapped to that connection.
The integration can be reconnected later using the same workflow if needed.
After completing the connection
Data availability
After configuration:
-
Datto EDR telemetry is associated with mapped organizations
-
Activity appears within alerts and investigations
-
Data is scoped by organization mapping
-
Synchronization is not immediate
NOTE It can take up to 15 minutes for organizations and devices to update after mappings are added or changed, even after the connection shows as successful.
Connection status and synchronization
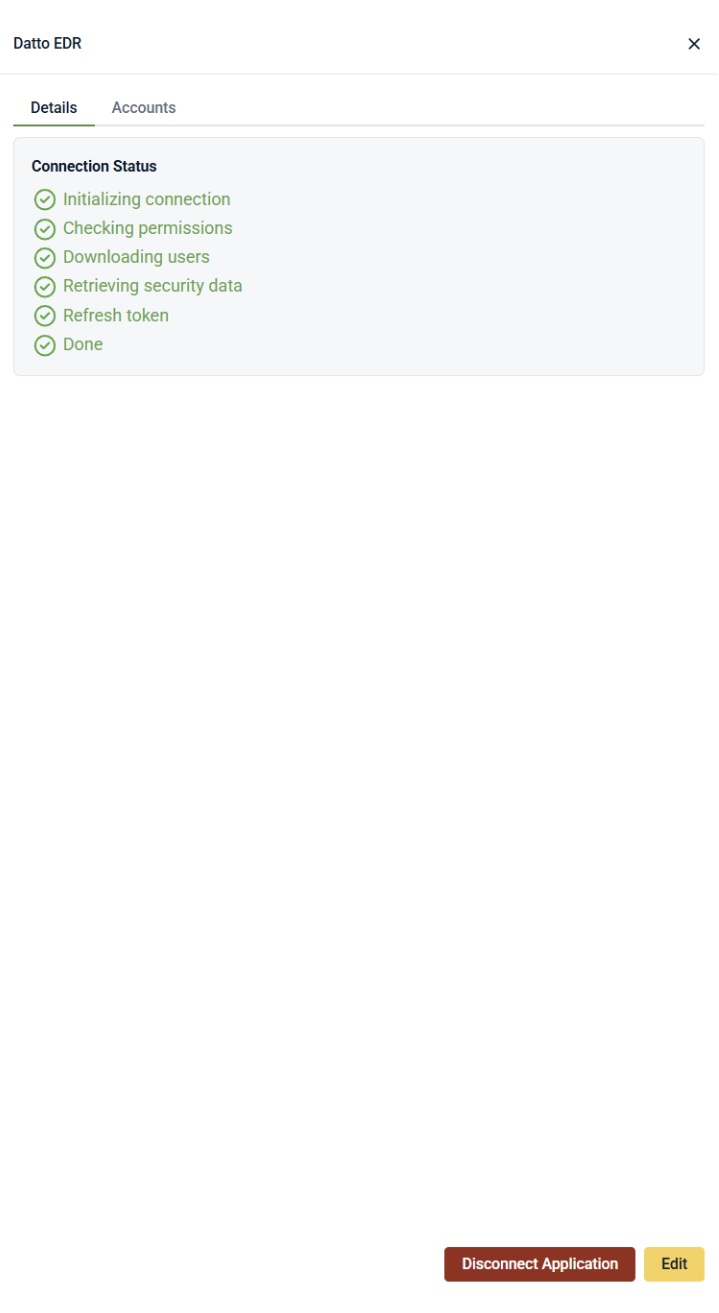
After Datto EDR is connected, the Integrations list shows a high‑level connection status (for example, Connected).
Selecting View details displays the current synchronization stage.
The detailed view shows a connection status panel that reflects the current synchronization stage. This may include steps such as initializing the connection, checking permissions, retrieving users, processing security data, or refreshing authentication tokens.
A status of Done indicates that the connection process has completed. It does not mean that all users or devices have finished synchronizing. Organization and device data may continue to update in the background after the connection is marked complete.
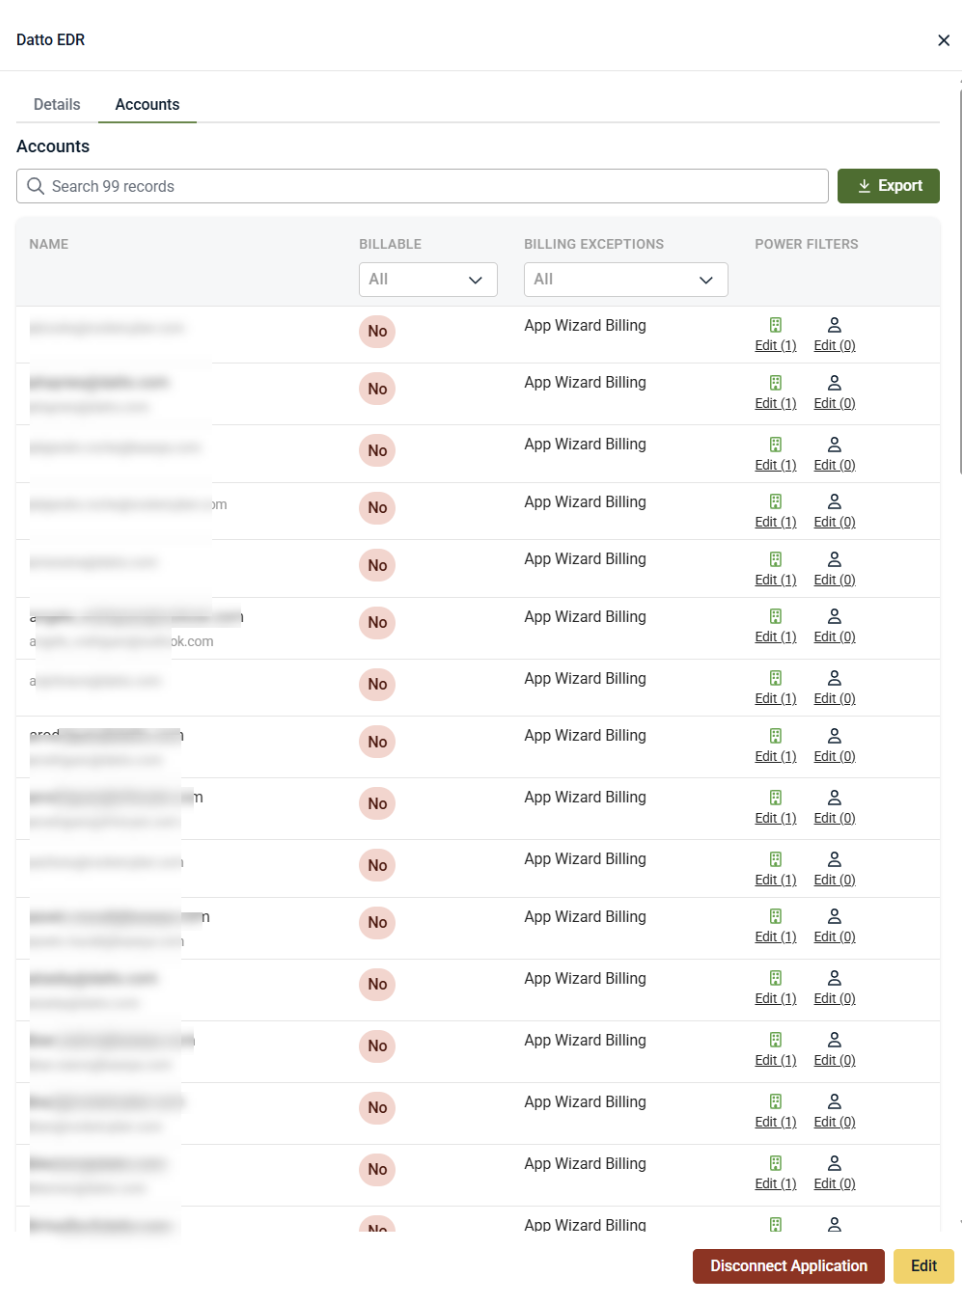
Accounts tab
After Datto EDR is connected, the integration details include an Accounts tab.
The Accounts tab displays the list of accounts and identities associated with the Datto EDR integration. This view provides visibility into which accounts are included and how they are categorized and displayed within Kaseya MDR.
From the Accounts tab, you can:
-
View accounts associated with the Datto EDR integration
-
Search and filter the account list
-
Export the list for review
-
See account attributes and status indicators as shown in the UI
The Accounts tab is informational and administrative. It does not control Datto EDR detection behavior, alert generation, response actions, or SOC workflows.
Troubleshooting
Customer Organization does not appear in the mapping dropdown
Cause: The organization has not been created in Datto EDR, or the API hasn't refreshed the list yet.
Solution: Ensure the customer exists as a distinct Organization in Datto EDR (not just a Group or Location). If it was recently created, click the Refresh or Sync button in the Kaseya MDR integration settings to force a new pull of the organization list.
All devices are showing up under a Default RMM Org
Cause: Datto EDR is configured using a flat structure (Locations/Groups) rather than the multi-tenant Organization structure.
Solution: To gain granular visibility, devices should be associated with a specific organization within the Datto EDR console. Kaseya MDR requires the organization-level boundary to map telemetry to the correct customer context.
Connection status says Connected but no data is appearing
Cause: The API Token may have insufficient permissions or the initial sync is still in progress.
Solution:
-
Verify the API Token in Datto EDR has Admin or Full Read permissions.
-
Wait at least 30 minutes for the initial handshake and data ingestion to complete.
-
Check the Accounts tab; if it is empty, Kaseya MDR is not receiving identity data from the EDR.
Duplicate Event alerts are appearing in the SOC
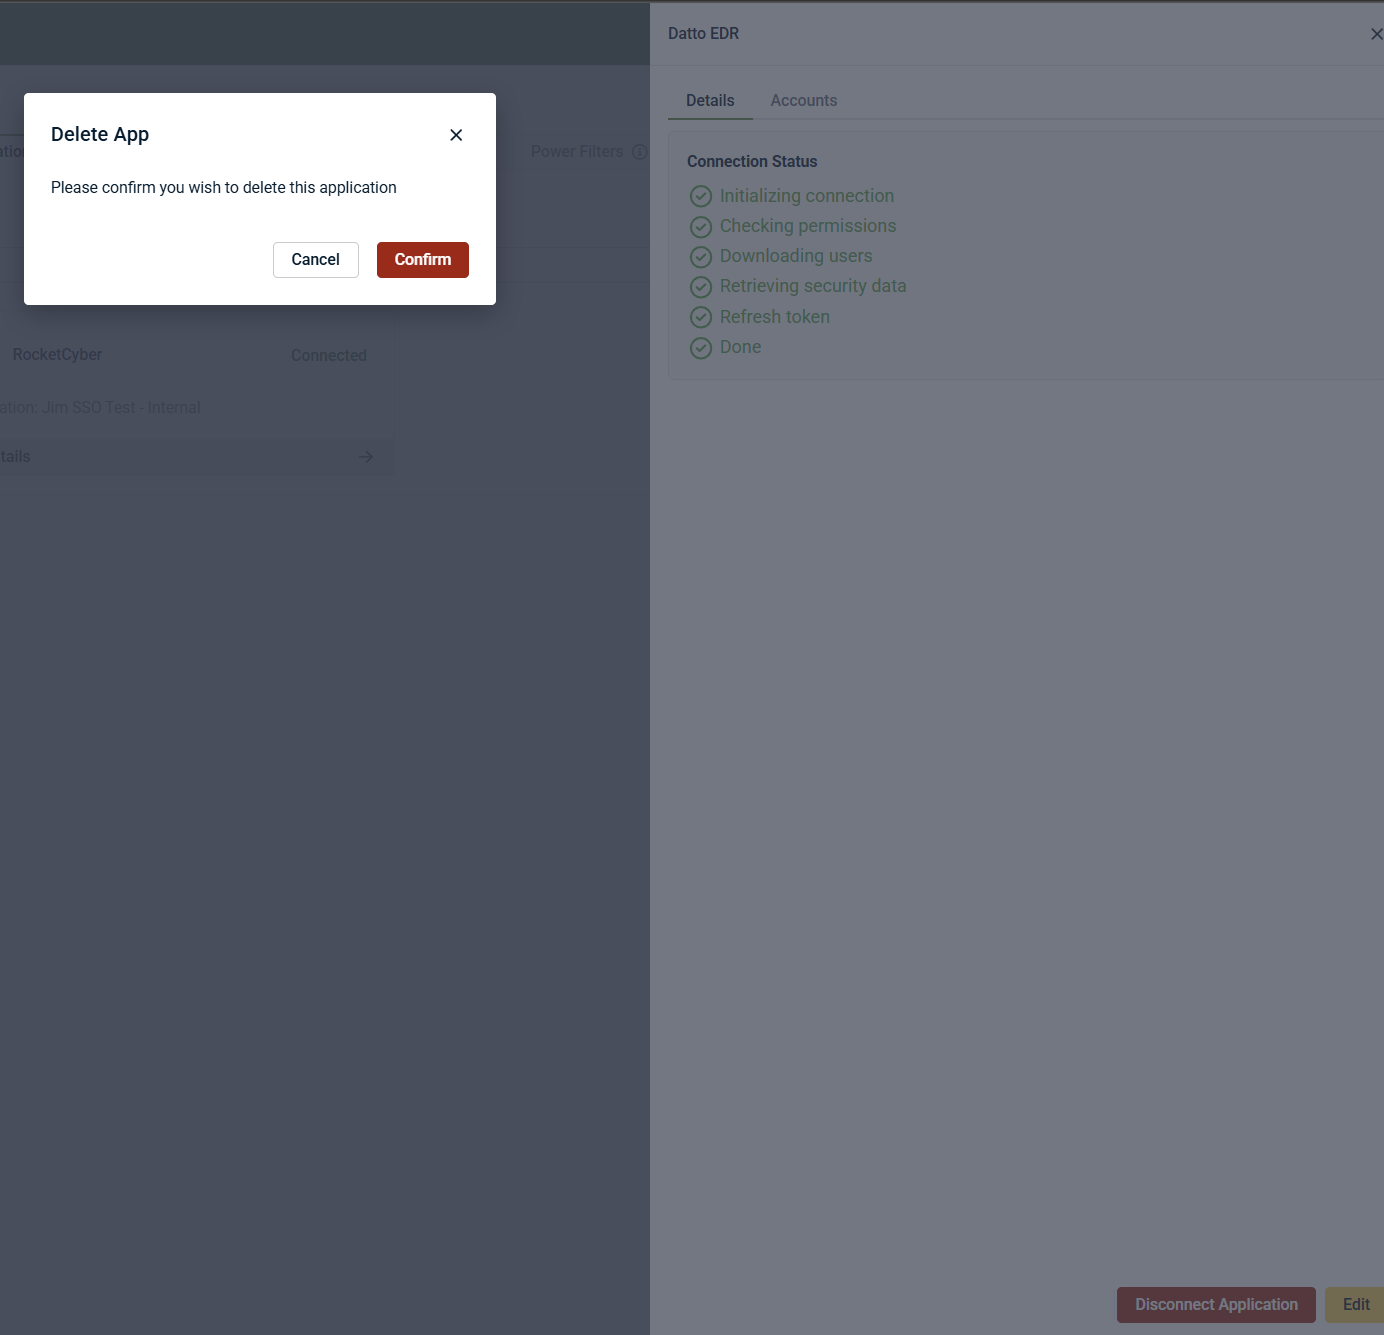
Cause: Datto EDR was accidentally added as a new application at the organization level while the partner-level connection was also active.
Solution: Delete the application from the individual Organization > Applications list. Ensure you are only using the Mapping tab to link the client to the master connection.
Related articles
-
Integrations and data sources: Overview of how integrations and data sources are represented and managed in Kaseya MDR
-
Connecting data sources and integrations: General guidance on connecting and managing integrations within Kaseya MDR
-
Endpoint and infrastructure sources: Explains how endpoint and infrastructure telemetry is ingested and used for investigation
-
Configuring Datto Ransomware Detection: Covers detection configurations that can use Datto EDR telemetry after integration
-
Best practices for integrating with the Kaseya Platform: Provides guidance on configuring Datto EDR alongside other Kaseya Platform modules, including alert routing, ransomware detection ownership, and avoiding duplicate notifications


